How much will a deep recession affect food prices?

us-cpi-1925-40-great-depression

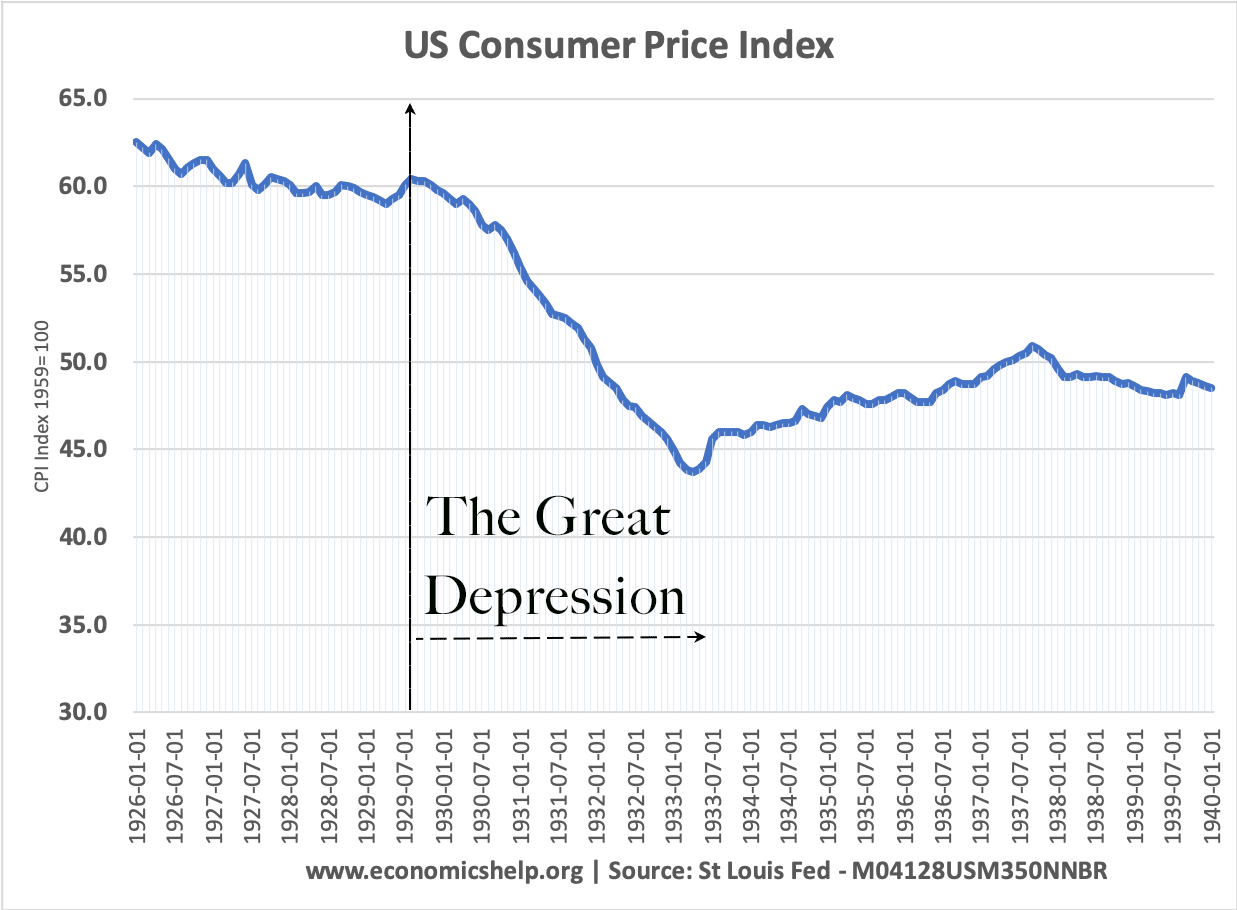
Food prices are typically fairly stable in a recession. If the recession is very deep and it leads to a period of deflation (fall in the general price level) then food prices may fall by a similar amount. US Deflation 1929-33 For example, in the great depression (1929-33), we saw a prolonged fall in prices. …

Read more

How do business know – Shall we put up our price?

profit-maximisation

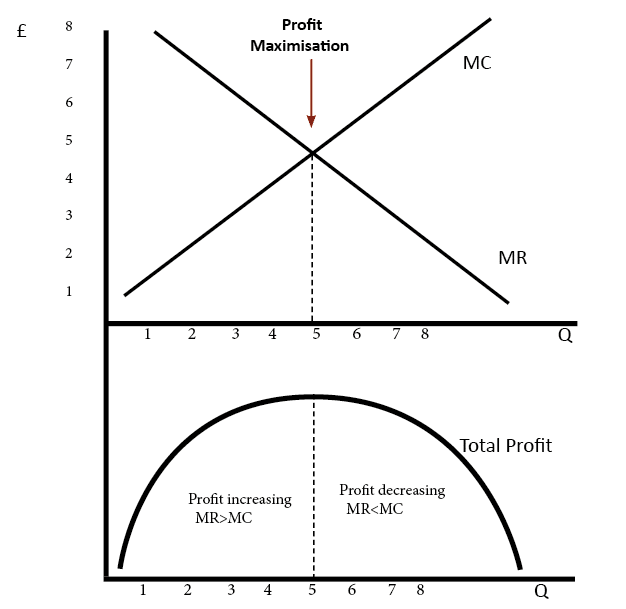
There are a few different reasons firms may put up prices, but in each case, a business will weigh up the pros and cons. Potential reasons for increasing prices An increase in costs of production. A general increase in the price level (inflation) Competitors are increasing the price. Firms believe demand has become more price …

Read more

Explaining supply and demand

difference-house-prices-supply-demand

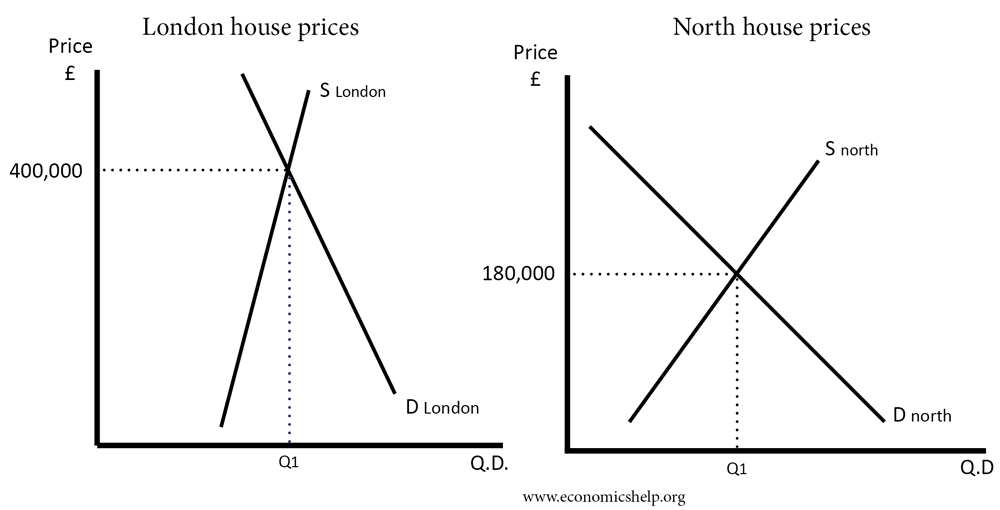
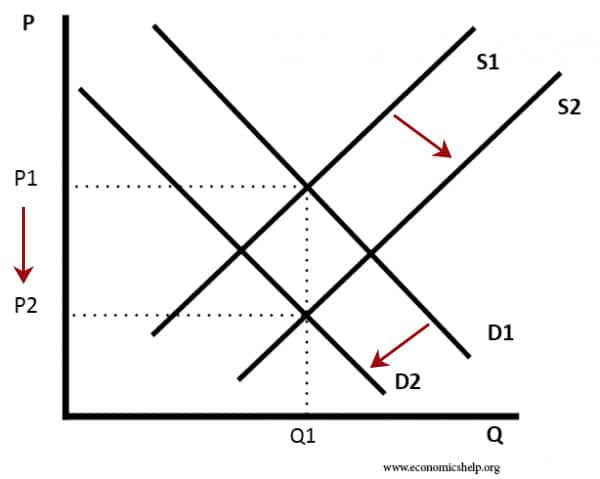
Supply and demand illustrate the working of a market and the interaction between suppliers and consumers. Supply and demand curves determine the price and quantity of goods and services. Any changes in supply and demand will have an effect on the equilibrium price and quantity of the good sold. It will also affect the incentives …

Read more

Explaining Supply and Demand

inelastic-supply-rise-in-demand

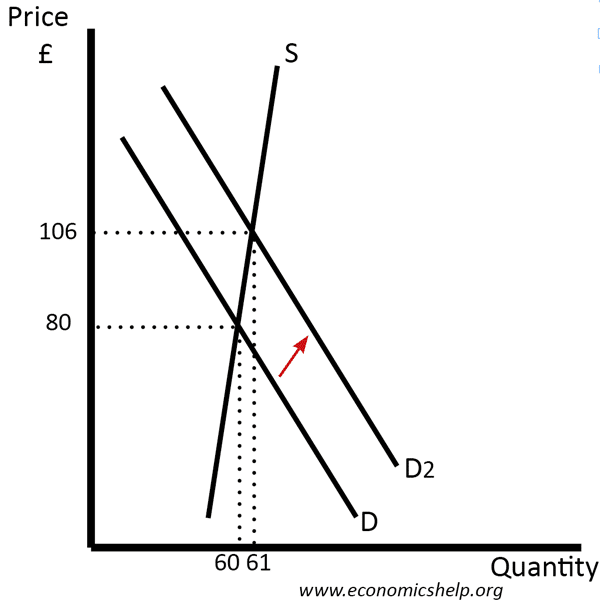
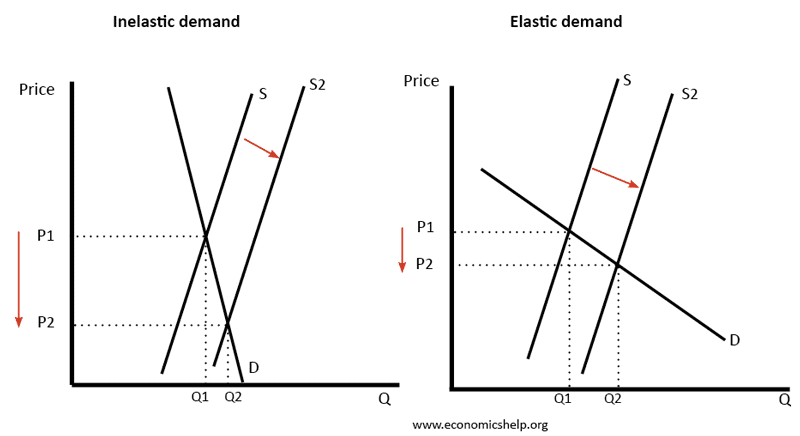
Supply and demand are a fundamental basis of economics; they help explain the determination of price and output in different markets. The supply curve shows the amount of goods firms are willing to sell at different prices. At higher prices, it becomes more profitable to sell the goods, so supply tends to rise with the …

Read more

The importance of elasticity of supply

elasticity-of-supply-effect-demand

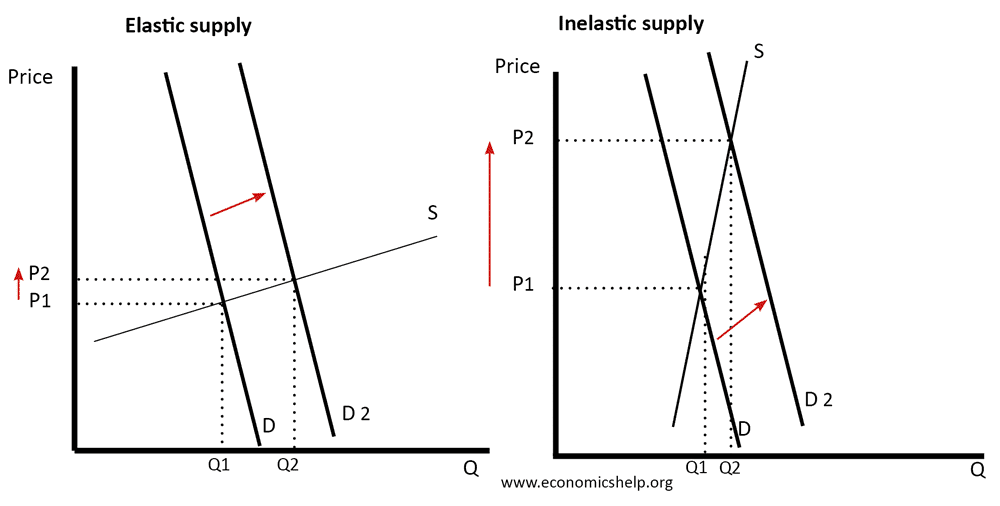
The elasticity of supply measures the responsiveness of a change in quantity supplied to a change in price. If price increases – firms generally find it more profitable to supply a good. So an increase in price leads to higher supply. However, if it is difficult to increase supply (e.g. shortage of capacity, difficulty to …

Read more

Diagrams for Supply and Demand

rise-in-supply-fall-demand-arrows

This is a collection of diagrams for supply and demand. It is mainly for my benefit, so when creating a post, like the price of tea (or when I’m teaching online) I can easily find a suitable diagram to illustrate what is happening. Demand curve  A contraction on the demand curve is due to higher …

Read more

Price Elasticity of Supply

effect-increase-supply-elasticity

Price elasticity of supply measures the responsiveness of quantity supplied to a change in price. The price elasticity of supply (PES) is measured by % change in Q.S divided by % change in price. If the price of a cappuccino increases by 10%, and the supply increases by 20%. We say the PES is 2.0. …

Read more

Income Elasticity of Demand (YED)

normal-luxury-inferior-good

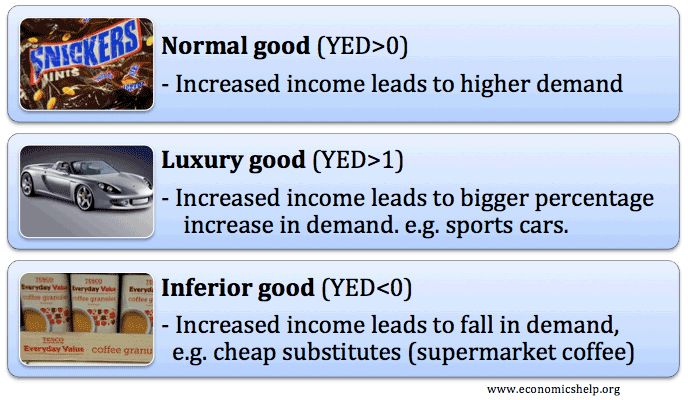
Income elasticity of demand (YED) measures the responsiveness of demand to a change in income. For example, if your income increase by 5% and your demand for mobile phones increased 20% then the YED of mobile phones = 20/5  = 4.0 Definition of Inferior Good This occurs when an increase in income leads to a …

Read more

Item added to cart.
0 items - £0.00