Understanding Rates of Change Statistics
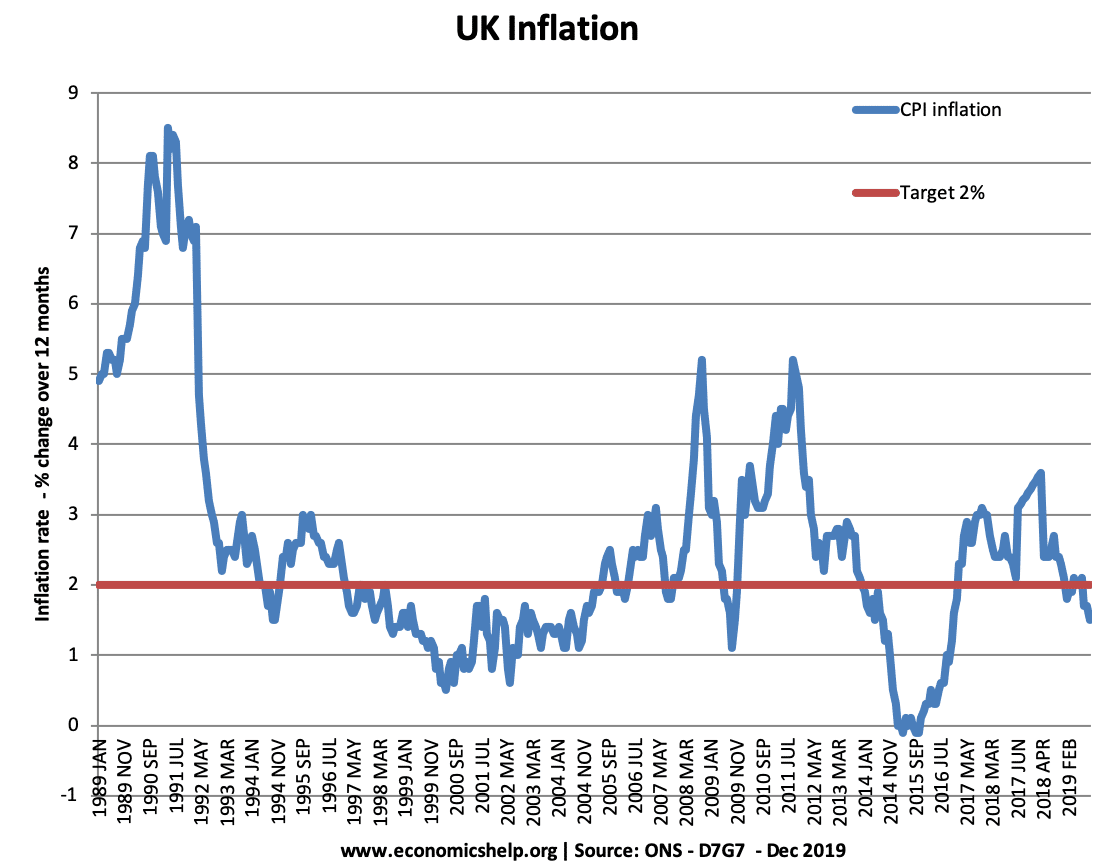
A Common question at AS and A2 Level is to understand economic graphs and statistics. Look at the graph below and explain what happens to GDP at current prices between 1974-1983? Many students will answer – In this period GDP is falling. However, this is wrong. What is happening is that the growth rate is …

