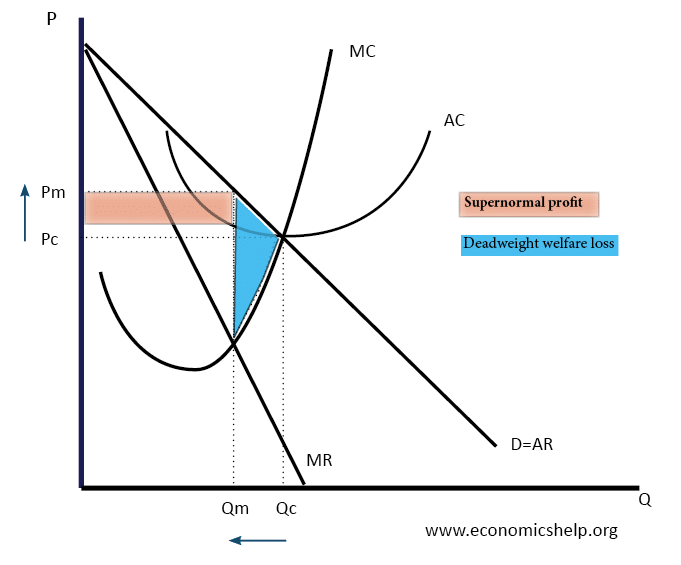
Diagram of Monopoly
Monopoly Graph A monopolist will seek to maximise profits by setting output where MR = MC This will be at output Qm and Price Pm. Compared to a competitive market, the monopolist increases price and reduces output Red area = Supernormal Profit (AR-AC) * Q Blue area = Deadweight welfare loss (combined loss of producer …

