New statistics from the ONS, show that there are large disparities in wealth within the UK. In 2010/12, aggregate total wealth of all private households in Great Britain was £9.5 trillion, (increasing from £9.0 trillion in 2008-10.
Some highlights from the report
- The wealthiest 10% of households owned 44% of total aggregate household wealth.
- The richest 1% have accumulated as much wealth as the poorest 55% of the population
- The poorest 50% of the population only have 9% of total wealth.
- Half of all households had total wealth of £218,400 or more.
- In 2010/12 the wealthiest 20% of households had 105 times more aggregate total wealth than the least wealthy 20% of households. In comparison, in 2008/10 the wealthiest 20% of households had 92 times more aggregate total wealth than the least wealthy 20% of households.
- The report doesn’t capture wealth in offshore havens.
- The most wealthy group are those around retirement age (55-64), with no children.
Source: Wealth and Assets Survey – Office for National Statistics
Definition of wealth
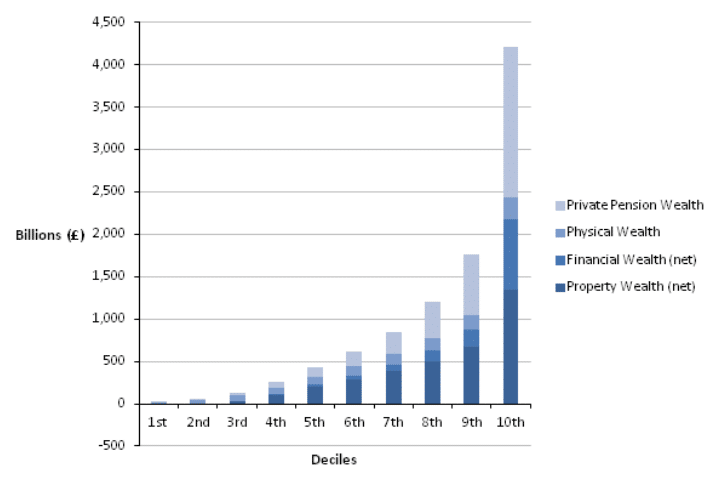
Wealth is a stock of assets that an individual has at any particular time; this can be assets in the form of money, pension, shares or property. The ONS split wealth into four main categories
Total wealth net property wealth, net financial wealth, physical wealth and private pension wealth.
- Property wealth – any property privately owned in the UK or abroad (£3.5tn 2012)
- Physical wealth – Value of physical assets owned by a household, e.g. antiques, artworks, vehicles and personalised number plates. (£1.1tn 2012)
- Financial wealth – Net financial wealth is calculated by subtracting from financial asset values the value of any financial liabilities. (i.e.. savings – debt) (£1.3tn 2012)
- Private pension wealth –The value of private pension schemes in which individuals can receive income from either now or in future. Private pension wealth was the largest component of aggregate total wealth. (£3.58tn 2012)
Facts about wealth inequality
- 11% of households in UK owned other property than their main residence 2010/12
- 24% of households had no private pension wealth in 2010/12
- 25% of households had outstanding amounts on credit card debts
- 7% of households had a personalised number plate
- 48% of households had an individual savings account ISA.
Regional inequality
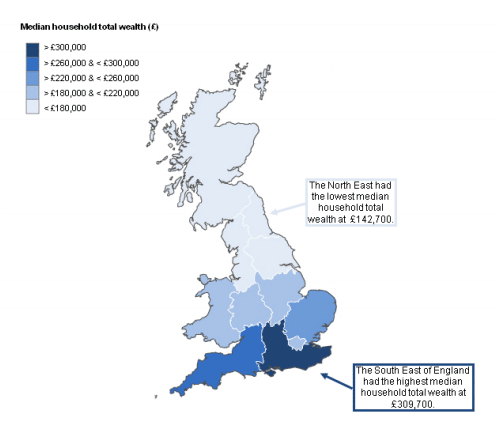
- The average wealth of households in the South East had increased to £309,000 at the end of 2012, up 30% since 2006-8 –
- The average rise in England was only 6%.
- Wealth in the north-east had fallen to just under £143,000.
- In Scotland, the average wealth is £165,500
- London had the biggest increase in household median wealth with a 31% increase.
Lorenz curve for individual wealth components
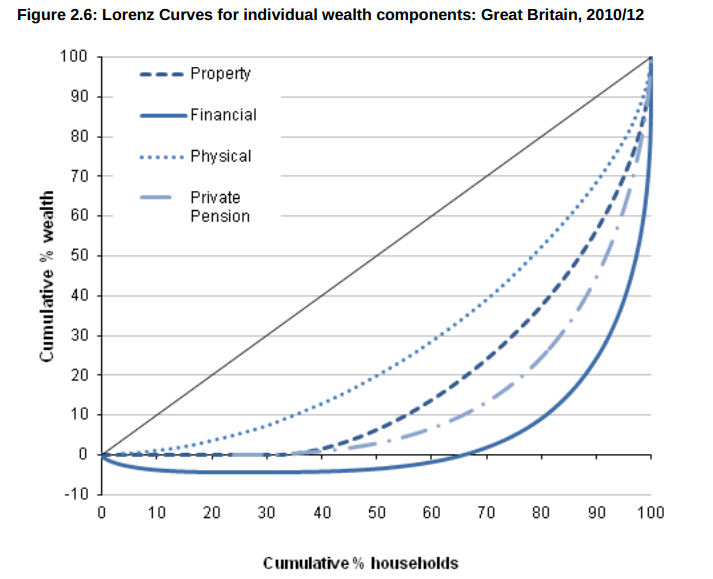
The closer the curve is to the line the greater the equality of distribution. Financial wealth has the greatest degree of inequality.
This shows that the poorest 60% of households had negative financial wealth (debt greater than savings)