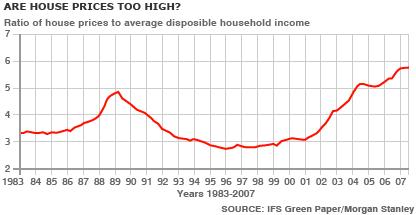
Graph showing Ratio of House prices to Incomes
This graph shows an interesting increase in the ratio of house prices to income. It is well know that UK house prices have increased significantly since 1993. In some areas the house price increase has been at least 300%, since the early 1990s. However, since 1998, house prices have been increasing at a much faster rate than incomes, meaning that the ratio of house prices to average disposable income is reaching an all time high of 6.
Note disposable income means the income after taxes have been paid.
Why House Prices are Set to Fall
- The effect of this is that house prices are increasingly unaffordable for many first time buyers. People are simply being priced out of the market and so demand is likely to fall. Other reasons why prices may fall.

