Could US Make Same Mistakes as Europe?

In 2009, US and EU unemployment rates both stood at 10% – but since then EU unemployment has increased to 12% and US unemployment fallen to 7.9%. (see: US v EU unemployment)

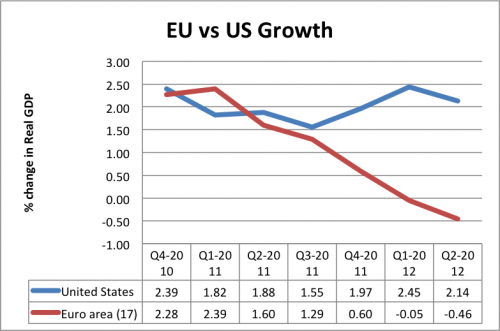
These contrasting fortunes in unemployment are a reflection of diverging rates of economic growth. Whilst, Europe has entered a double dip recession, the US has experienced a sustained economic recovery. It is also a reflection of different economic policy – the EU has become obsessed with reducing budget deficits, the US has given more focus to promoting economic recovery.

recession

However, in the face of concerns over levels of US government borrowing and impending debt ceilings, many in the US are pushing for a rapid fiscal consolidation.

But is US austerity necessary? and what will be the impact of austerity on a) the budget deficit and b) economic growth c) long-term structural spending and debt commitments?

Is Austerity Necessary in US?

total us debt

Total Federal Debt increased to 101% of GDP in Q2 2012. It is a sharp increase since 2008, when debt was just over 60% of GDP. But, this is to be expected in a recession as deep as past recession.

Read more

Broadband Statistics in UK and Rest of World

broadband statistics
Source: OFCOM

Broadband access in the UK. Also showing different access points to broadband.

In the space of less than 10 years, Broadband access has come to be seen as a vital public amenity. It is used for business, retail and is increasingly seen as one of the factors which can show the degree of economic development in an economy.

Also, in a fast moving market, there has been a strong growth of mobile broadband, as people increasingly check the internet from their own smart phones. With 20% of UK households still not receiving broadband, the government has announced policy measures to support the rolling out of broadband in rural areas.

Read more

Why Do People Not Notice Economic Growth?

Readers Question: why does economic growth not get noticed by the man on the street?

  • Recently, the ONS released a report saying that real wages were 62% higher than in 1986. This is the result of sustained economic growth. (Real wages take into account inflation.)
  • In April 2011 the average full-time employee in the UK earned around £12.62 per hour excluding overtime.
  • This is a monetary (nominal) increase of 226% since 1986 when the average wage was £3.87 per hour.

Inequality of Real Income growth

  • The top 1 per cent had the biggest increase between 1986 and 2011, at 117%
  • The top 10 per cent saw an increase of 81%
  • The bottom 10 per cent had a 47 % increase.
  • The very poorest did better, with the lowest 1 per cent having a 70% increase.


However, in the period 2007-11, all income groups have seen a fall in real wages as nominal wage growth has failed to keep up with inflation.

real GDP

If we asked people do they feel better off than 1986, it is hard to know what people would say. I’m sure some would feel better off, but many may reply they don’t. Why don’t people notice economic growth? Some possible reasons:

  • Economic Growth and living standards. Economic growth measures the increase in real GDP (real output, real incomes). However, GDP  is often a poor reflection of living standards and peoples sense of well being. For example, despite rising real incomes, people may not feel as well off. This could be because:
    • Quality of life diminished by pollution or increased congestion
    • Increased fear of crime that may occur with economic growth. (Ironically, with more income, people have more to lose. Crime rates are higher in the UK, than in the 1930s – a period of greater poverty)
    • see also: difficulty in measuring living standards

      Read more

US Fiscal Cliff Explained

One of the most talked about issues in US politics is the US fiscal cliff.

The fiscal cliff refers to the situation at the end of 2012, where a series of tax increases and spending cuts (worth $600bn)  are due to come into force automatically. This amounts to  This will reduce the budget deficit, but cause lower growth. The alternative is to reject these planned budget cuts and allow the deficit to continue to grow. This will allow stronger economic growth, but leave the debt issue unchallenged.

A complicating factor for US politics is the debt ceiling. This is the legal amount by how much the government can borrow. The debt ceiling can be raised, but it has to go through the Senate to be voted on. This gives scope for political wrangling and efforts to push for some favoured spending cuts in return for allowing debt ceiling to be raised.

The debt ceiling was raised on January 30, 2012, to a new high of $16.394 trillion.

Read more

American Election Economics

I only take a passing interest in American politics. I’m just grateful not to live in Ohio, where voters have been subject to hours and hours of political ad campaigns. According to a newsnight presenter, if the 150,000  ads were all lined up, they would last for four consecutive days. (although I’m sure that would constitute cruel and unusual punishment. I think I’d talk after the first six hours). I’ve never seen an American political ad, but I doubt they explain the nuances of balance sheet recessions, liquidity traps and the optimal way to reduce debt to GDP ratios without con straining economic recovery.

But, despite economics being somewhat in the background, the re-election of Obama could be seen as a political confirmation that:

The recession was the result of the financial excesses in the lead up to 2008 – and not really the present administration.

us

Overcoming this unique balance sheet recession was always going to be difficult and long process. The US has performed moderately – but much  better than many of its fellow countries. To some extent Obama deserves credit for allowing a recovery – even if it could have been stronger.

In a country which loves the laissez faire ideal like no others, it’s interesting to still see solid support for the idea that government intervention can actually make markets work more efficiently. Obama supported the rescue of the automobile industry with government money. Romney opposed the use of federal funds. The bailout was a success, so it’s only fair Obama did well in the ‘rust belt’ north. Even the hurricane Sandy is a reminder that for real crisis, government rescue funds can play an invaluable role. Recent years have been a reminder that the highest ideal of government is not just to reduce taxes on the rich.

Read more

Does Disaster Relief Provide Economic Stimulus?

Readers Question: “Is it a fallacy to assume that Super-storm Sandy will promote growth and, if so, why?”

In the aftermath of a natural disaster, such as hurricane ‘Sandy’ which recently hit New York and New Jersey. there is usually a fairly minimal impact on GDP.

The devastation by the storm has cost something in the region of $30 billion to $50 billion in economic losses. This approximates to around 0.25% of nominal US GDP. These economic losses include:

  • Damage to property, assets, infrastructure and factories.
  • Lost output because people can’t work. If affected areas lose 25% of output for two days, this would add up to around $6billion of GDP.
  • Lost tax from lower revenues.

The worst losses will not be visible in GDP statistics because much of the damage has come to wealth as opposed to output. In this case, GDP statistics are not a true reflection of living standards because of their focus on output and income – as opposed to wealth.

Read more

Can we save our way out of the Pension Crisis?

Readers Question. We hear much about the “pensions time bomb”, as people tend to live longer and there is a bulge as “baby boomers” reach retirement age. We also hear much about the need to save for retirement. Saving *money* may mean people have more money in retirement but surely the real problem is to ensure there is more output; money is worth only what it can buy. Is there a risk that money saving will simply reduce current output and so reduce the income and incentives needed to ensure we have the investment that will enable us to increase output over time?

It is easy to see how it makes sense for an individual to save for retirement but at the national level, it may be counter-productive.

Basically, is there a concern that higher savings for pensions will lead to lower economic output?


Forecast for Dependency Rates

Source: Dept for work and Pensions

Firstly, western economies do face a pension time bomb. Dependency rates are forecast to rise (though the UK is unlikely to be as badly affected as other countries, such as Spain, Italy and Japan.) An ageing population means state pensions will take up a bigger % of GDP. Higher savings would help with the private sector pension deficit and provide more funds for pensions. But, would higher savings lead to lower growth?

Read more

Why Government Debt Forecasts were wrong

One feature of the recent crisis has been the degree to which governments underestimated the forecast rise in government borrowing. The IMF produced a report which looked at forecast debt from 2007, and what debt actually was three years later. In ten selected countries, the increase in the gross debt ratio 31.8

  • 2007 forecast for debt in 2010 – 58.8% of GDP.
  • Actual government debt in 2010 – 90.6% of GDP

To some extent, this reflects the wider failure to forecast the recession. As well as underestimating debt levels, governments proved widely optimistic on GDP and unemployment. However, the recession wasn’t the only reason for governments to underestimate debt levels. There were also failures to account for liabilities, such as hidden obligations to public corporations and Public private finance initiatives. This shows that many countries need to improve their fiscal transparency.

  • Fiscal transparency can be defined as the clarity, reliability, frequency, timeliness, and relevance of public fiscal reporting and the openness to the public of the government’s fiscal policy-making process.

Why Forecasts were Wrong

There was quite a degree of variability in why debt forecasts were wrong. For example, in the UK there was only a minor underestimation of its fiscal position (3.7% of GDP). Most of the UK’s higher than expected debt were a consequence of the unexpected recession and financial sector intervention.

Read more

Item added to cart.
0 items - £0.00