Welfare spending in the UK is a controversial topic. There is significant political and public concern at the growth of welfare spending in the past few decades. In particular, there is a fear that the growth of the welfare state is encouraging a ‘dependency culture’. But, how much has welfare spending actually increased by? Are we really a nation of scroungers or is the extent of welfare payments exaggerated? One important point to bear in mind is that in a recession, we expect welfare spending to increase. That is really the whole point of the welfare state – to provide a minimum income during a period of temporary unemployment.
Welfare spending includes benefits the government pay to those out of work or on low incomes. It includes:
Job seekers allowance – unemployment benefit
Income support
Housing benefit
Child Benefit
Winter fuel allowance (1)
Growth in Nominal Welfare Spending
Since 2001, welfare spending has increased from £57bn t0 £115bn. However, the government are planning to stabilise welfare spending at £115bn through limiting entitlement and the increase in the amount paid. The government may argue without firm action now, the trend would see continued unaffordable increases in welfare.
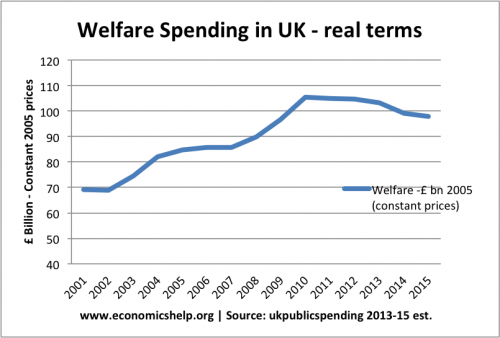
Welfare Payments in Real Terms
If we look at welfare payments in real terms (adjusted for inflation), we see the growth is less spectacular. Nevertheless, even adjusted for inflation, the welfare bill has increased by £34bn since 2001.
Interesting post by David Blanchflower about the best form of economic stimulus – Here’s a way to end the slump (Useful for any economic student wishing to understand marginal propensity to consume – mpc)
An economic stimulus in 1936 increased demand for model T Fords
A fiscal stimulus could involve a tax cut or government spending increase. This should increase overall aggregate demand, and boost economic growth.
A monetary stimulus could involve interest rate cut or policy of quantitative easing.
But, if we decide to pursue fiscal stimulus – How do we make sure this has the biggest effect on increasing overall aggregate demand? Who is the best group of people to give it to?
For example, If you cut the higher rate of marginal income tax 50p to 40p for incomes over £100,000 – then this tax cuts is most likely to be saved. This is because people with salaries of over £100,000 are not in great need of buying essential items. They probably have most items they need. If they gain an extra increase in income, a large proportion will just be saved. They may buy one or two extra luxuries, but comparatively, they will have a low marginal propensity to consume. Therefore, the effect of the fiscal stimulus will be largely dissipated. You could argue that a low income tax may have a supply side incentive, but at 50%, it is debatable how significant this will be.
If you cut capital gains tax, it would benefit a relatively small percentage of wealthy firms and individuals. Again, you would expect a relatively low marginal propensity to consume. There may be some extra investment. But, in the current climate, you would expect business to be risk-averse. It’s hard to see businessmen rushing to invest because of lower capital gains tax.
Quantitative easing is a form of monetary policy which has given extra cash reserves to banks. Yet, this has had a very limited stimulus effect. Basically, banks have been saying thanks very much for the cash, we will use it to improve our bank reserves, but not to engage in a risky investment.
What about if we gave it to those on a very low income. For example, low paid workers, who have seen a 10% real pay decrease in the past few years? or increase unemployment benefits? Here, you would expect a higher marginal propensity to consume. The problem is that increasing benefits to the unemployed is not going to gain you too much political kudos.
In 1936, the US government gave a stimulus to a group of low-income people – military veterans from the First World War. The US Congress authorised $1.8bn to 3.2 million war veterans (2.1% of GDP) = (to put stimulus into perspective – 2.1% of GDP is equal to £30bn in UK). The money was financed from a bigger government deficit.
Joshua Hausman from UC Berkeley argues that the bonus added 2.5 to 3 percentage points to 1936 GDP growth and lowered the unemployment rate by 1.3 to 1.5 percentage points. Contemporary newspaper accounts reported that veterans were keen to spend this extra money. Many used the $550 + payment to buy their first-ever car. Fortunately, the price of the cheapest Ford car was $500.
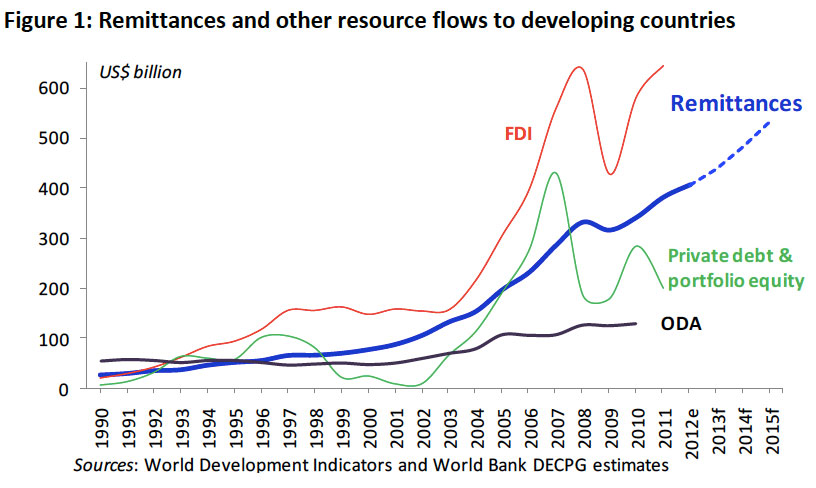
We tend to consider the impact of immigration on our own country. – How do immigrants affect UK unemployment? UK housing? UK labour markets? and GDP (e.g. economic impact of immigration). However, the flip side of the coin, is how does migration affect developing economies? Recently, the World Bank reported that migrants working in developed economies sent a record breaking level of remittances back to the developing world.
In 2012, the World Bank estimates that migrant workers sent $406 billion in savings to their families in developing countries. (World Bank blog)
The World Bank expects this to reach $534 billion by 2015.
Remittances sent to all countries in 2012 (developing and high income) was $534 billion.
These remittances were three times greater than aid budgets to the developing world.
The figures for remittances underestimate the actual total because they only include money sent through official channels.
The World Bank state that banks and transfer unions are taking an unfairly high commission (up to 20%) with the average transfer fee being 9%. Sub Saharan Africa has one of highest costs of sending money to. Reducing commission fees would substantially improve the benefit of remittances.
Remittances and other Transfer Flows to Developing Economies
Remittances growing faster than overseas development aid ODA. Remittances are less cyclical volatile than FDI (Foreign Direct Investment) and portfolio equity.
Recently, there has been much focus on US public sector debt – the total amount the government borrows. These graphs show the combined debt levels of both the public and private sector. Private sector debt is split up into households, non-financial companies and financial corporations.
In the run up to the 2007 financial crash, we have a rise in total debt levels. – especially amongst households, and financial. Note debt to GDP continues to rise in 2008/09 – because GDP fell sharply in these years.
From 2009, we see a fall in debt levels in the private sector (non-financial corporations, financial firms and households all see lower debt to GDP). This is what you would expect in the aftermath of credit crisis, housing slump and recession – firms and households seek to improve their balance sheets – pay down debt, increase saving, reduce investment and reduce consumer spending.
From 2008 to 2012, US government debt increases from below 60% to 90% of GDP. But, placed in this context of falling debt levels in other areas of the economy, it sheds a different light.
Undoubtedly, the rise in US government debt helped to offset the fall in private sector spending and investment. If the government, had attempted to reduce the budget at a quicker rate or if they had attempted to maintain government debt at some pre-determined level (e.g. 60% is often mentioned in Eurozone targets), the US wouldn’t be seeing the economic recovery it is seeing. (e.g. US vs EU unemployment)
A very crude and simplified explanation of Keynesian economics is that falling private sector spending should be offset by rising government spending – even if the government has to borrow from the private sector.
The fact that the private sector is wanting to pay down debt and increase savings, means that there is higher demand for government bonds, and this is why bond yields have fallen during this period of rising government debt.
Total US debt has actually fallen from 2008 – a marked contrast to the previous two decades.
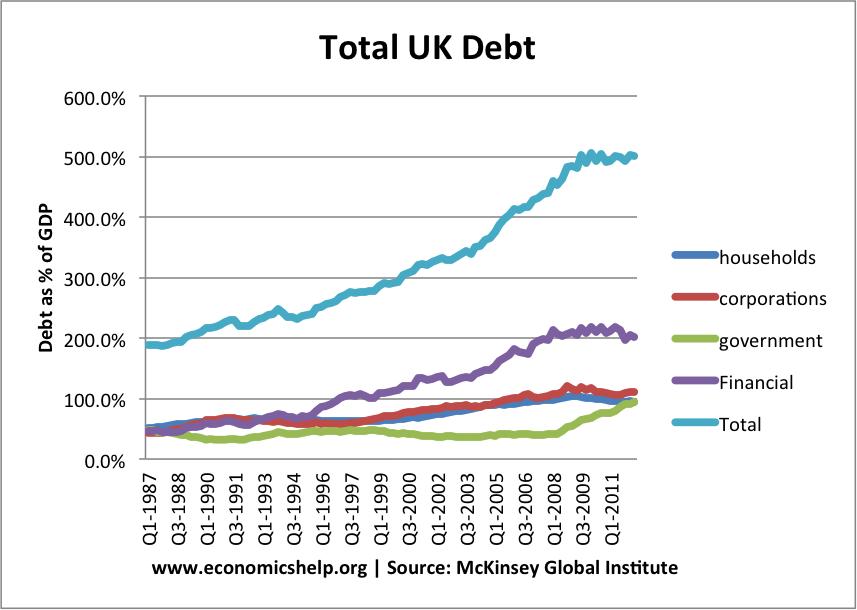
When examining debt levels in the UK, there is government debt – measured by public sector borrowing (often referred to as National debt). See: UK National Debt.
We also have private sector debt which is composed of personal loans, personal mortgages, business debts, and debts of the financial sector.
Total Debt includes both private sector debt plus government debt.
Private sector debt can be split up into
Household debt – personal loans
Non-Finance corporates – Company debts
Financial – debts of banks and financial corporations
Total UK debt
total UK Debt – Private + Public
Total UK debt increased sharply in period 1994-2007.
Since 2008, there has been a fall in household debt as a % of GDP – as households cut back debt levels. (note GDP also fell in this period)
Financial sector debt has stayed constant at 200% of GDP.
Main Features
Total UK debt is 500% of GDP in mid 2012
The largest component of debt is from the financial sector.
The deleveraging is greater than may appear from the statistics. Although debt levels have remained flat, this is against the backdrop of falling real incomes.
Readers Question: how can Germany show a surplus? I mean I can understand that German exports have always been their main source of income , but with all the world exports shifting to China and India wouldn’t we expect the German exports to decline? Thanks! German Current Account Surplus Germany has a current account surplus. …
Interesting to read this from Lord Oakeshott, the Liberal Democrats’ former Treasury spokesman
“The economy is as flat as a pancake. No growth means no progress in the Coalition’s central purpose of reducing the deficit. We Liberal Democrats did not sign up to stagflation and a vicious circle of self-defeating cuts. It is time to challenge the Treasury orthodoxy that has learnt nothing since the 1930s.
The Treasury View could be summarised as the belief that:
The budget deficit needs to be reduced whatever the economic circumstance. The Treasury view states that balancing the budget is important for restoring confidence. (See: Confidence Fairy)
The Treasury view usually states that austerity measures will not adversely affect the economy. e.g. Cutting government spending will cause a rise in private spending to replace it. In other words, government spending is crowding out private spending.
The Keynesian view criticises this Treasury orthodoxy because they argue in a recession, government spending is not crowding out the private sector.
In 1931, Treasury officials put pressure on the government to implement an austerity budget – Tax increases, and cuts to unemployment benefits in the middle of a recession. (It led to the minority Labour government breaking up, with most Labour MPs leaving government. The hapless Ramsay McDonald was left to form a National Coalition with mainly Conservative MPs.
The austerity during the height of the Great Depression made the economy worse – though leaving the Gold Standard did help.
The sad thing is that the Treasury view had also prevailed in the UK during the 1920s.
In an effort to reduce national debt as a % of GDP, throughout the 1920s, the UK ran primary budget surpluses throughout the decade (excluding interest payments, tax revenue was greater than government spending). Yet, despite these efforts at fiscal austerity, national debt as a % of GDP was stubbornly high and failed to fall because (apart from a few years) growth was stagnant.
Years of austerity failed to make a dint in national debt as a % of GDP.
Readers Question: Hello! I was just wondering in the midst of the European crisis when all economically strong countries have been downgraded? Many countries in the Eurozone have seen a downgrading in their credit rating for Government debt. The economic crisis saw a sharp rise in levels of government debt to GDP. In a recession, …