Daily Mail Economics

The definition of Daily Mail Economics. The deliberate use of economic data to create fear, worry or exaggerated concerns about the state of the economy and society. Daily Mail economics is not limited to the Daily Mail, it may appear in any newspaper or blog, but the Daily Mail and Daily Express usually have quite …

Read more

The Great Moderation

The great moderation refers to a period of economic stability characterised by low inflation, positive economic growth, and the belief that the boom and bust cycle had been overcome. In retrospect, economists look back on the great moderation in a different light because although inflation was low, there was great volatility in financial markets and asset prices.

inflation-growth-90-12
The UK great moderation from 1992 to 2008 low inflation, positive economic growth.

Generally, the great moderation refers to the period 1986 – 2006.

In the UK, the great moderation is considered to be the period 1993-2007 because the UK had a classic boom and bust in late 1980s and early 1990s. The UK experienced 63 consecutive quarters of economic growth between the end of the 1991 recession and the recession in 2008 – the longest continued expansion on record.

Wage growth

wages-inflation-2000-2007

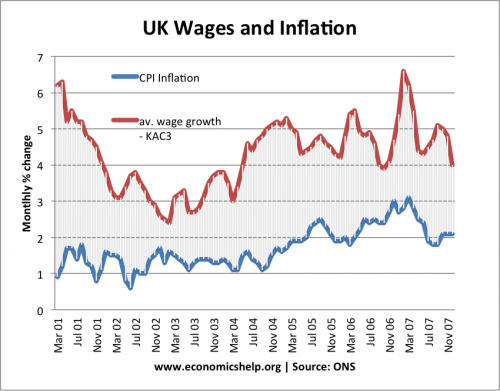
This was typical of wage growth during the great moderation. Average wage growth above CPI inflation causing a steady growth in living standards.

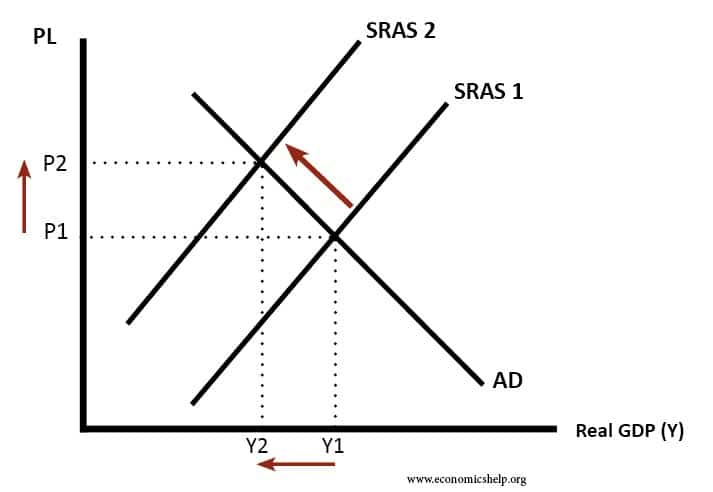
Before the great moderation – boom and bust trade cycles


inflation

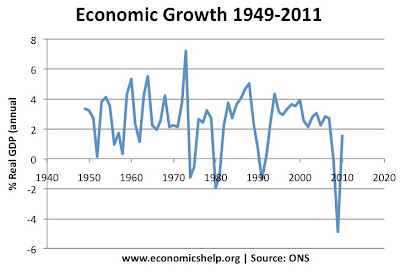
In the post war period there seemed to be a fairly consistent business cycle. Economies would experience, high growth (a boom), but with high growth came inflation. After a period of inflation, the economy would slow down and sometimes go into recession  (see boom and bust). It appeared the business cycle was volatile and inflation difficult to bring under permanent control. The 1970s, saw even greater volatility with oil shocks causing high inflation.

Features of the great moderation

After the volatility of the 1970s and 1980s, the great moderation was seen as a welcome end to this volatile growth and inflation. The great moderation had various aspects.

US inflation
US inflation, after early 1980s, inflation generally stays close to target of 2.5%
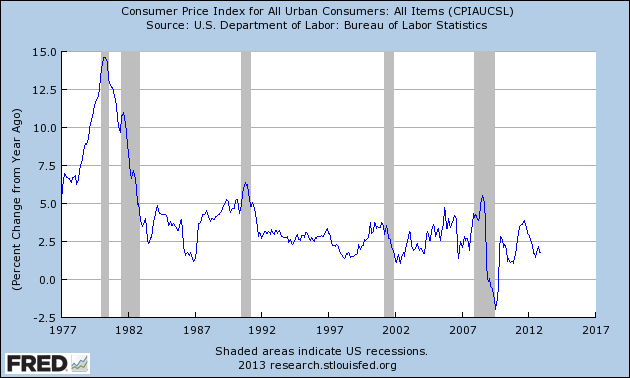
  • Low inflation. The most prominent feature of the great moderation was persistently low inflation. It appeared that Central Banks could keep  inflation low – without compromising unemployment or economic growth. The Phillips curve had either shifted to the left or was no longer relevant. There was a certain excitement that we were seeing the end of boom and bust.
  • Stable growth. With low inflation, we avoided the boom and bust cycles. The UK had their longest period of economic expansion on record 1992-2007. Apart from a minor dip in 2001, the US economy grew strongly during 1986-2006.
  • The end of uncertainty and greater risk taking. The benign macro economic situation encouraged investment in both capital and financial investments. During the 1980s and 1990s, there was a period of financial deregulation which encouraged a growth in complex financial derivatives, such as credit default swaps. Financial institutions became willing to take on more risky investments because they were more confident that there wouldn’t be any major economic downturn. Banks became more highly geared as they lent out a greater % of their assets. For more on how macro stability increased risk taking – see Financial instability hypothesis
  • Rising asset prices. Asset prices, especially houses, saw a rapid growth in prices. House prices rose because of low interest rates, a stable macro-economy, and growth of mortgage lending. House prices rose faster than inflation, and even faster than incomes. Some were worried house prices were becoming overvalued, but others felt house prices weren’t overvalued because of either limited supply or the growth of new mortgages meant more people could now afford to get a mortgage.

Read more

Unemployment and job applications per vacancies

On the day, that the official unemployment figures fell to 7.8%, there was also news that more than 1,700 people applied for 8 positions at Costa Coffee in Nottingham. (Independent) The labour force survey suggests that here are currently 2.50 million unemployed people, down 14,000 on July to September 2012 and down 156,000 on a …

Read more

The wrong and right kind of inflation

I like this article about the wrong kind of inflation by Roger Bootle

Or as his cleaner said:

“It’s not the inflation they need to sort out, Mr Bootle, it’s the rising prices!”

Essentially, the wrong kind of inflation is  cost-push inflation. This inflation is due to rising costs of production, such as rising energy prices, rising transport costs, imported inflation and rising food prices. This inflation causes a shift to the left of short run aggregate supply. A simple SRAS / AD diagram shows how this kind of inflation also causes a fall in real GDP.

The wrong kind of inflation
SRAS-shift-left

Cost push inflation, causing rising prices and falling real GDP.  (note some textbooks may show SRAS as a straight-line, but the principle is the same)

This wrong kind of inflation leads to a fall in living standards.  Since 2008, the UK has seen a fall in real wages. We have had the worst of both worlds – rising prices, but falling incomes (or at least stagnant incomes)

This bad type of inflation doesn’t cause a rise in wages. But, a fall in real wages. We may laugh at Mrs Bootle’s cleaner, but in a way she might be trying to say, inflation isn’t a problem, if money wages keep up. If money wages grow faster than inflation, then we can afford the rising prices. Our income has increased to meet the higher cost of living.

Read more

Iceland’s Recovery

Iceland’s crisis was brutally severe. With a bloated current account deficit and bad debts, Iceland experienced a severe balance of payments crisis and banking losses. Iceland responded by:

  • Not guaranteeing all banking debt. Many large banks failed and were seized by the government
  • Allowing the currency to devalue by 50%.
  • Imposed capital controls to prevent the outflow of money.

This response is in contrast to countries like Spain and Ireland. In Ireland, the government implemented a very costly bank bailout – which in turn caused the Irish government to seek a bailout.

Yet, just five years after allowing banks to go under, Iceland is being rehabilitated into the international capital markets, with rating agencies upgrading Icelandic bonds from ‘junk’ status to BBB. (Guardian)

Iceland has succeeded in stabilising the macro economy, reducing the debt to GDP burden, and importantly has seen positive economic growth – helped by a substantial devaluation. The devaluation also helped to rebalance the economy and reduce the budget deficit.

The collapse of the bloated finance sector had another advantage. Iceland’s traditional exporters have now found they could employ graduates at reasonable salaries. Previously, graduates had been poached by banks with seemingly inexhaustible supplies of money. This has helped rebalancing the economy to the more ‘real’ sector.

Iceland_GDP_forecast_2012

Iceland GDP

After experiencing 10 quarters of negative growth, the Icelandic economy has grown for the past two years at an average of 2.5%. Unemployment has fallen to 5% and confidence is returning.

Read more

Cost of Servicing Debt

Readers Question Richard Drayton, the Professor of Imperial History at Kings College London, says in a letter to the London Review of Books: “What is clear is that in May 2010 the percentage of UK GDP which went to servicing debt, even after the impact of the 2008 crisis, was, at 2.5 per cent, at the lowest level enjoyed by any Conservative government since Lord Salisbury was at the Treasury in 1900.” http://www.lrb.co.uk/v35/n02/letters

Yes, as far as I can tell. Historical debt interest payments are not so easy to find. But, In 2010-11, debt interest payments were £44bn  or 3% of GDP.

A few months ago I spent considerable time researching and found these statistics. The ONS said they don’t produce statistics. HM Treasury publish data, but it’s not easy to find – usually hidden away. More at Debt interest payments.

Source: A view of UK public spending

Historically, debt interest payments have been a higher % of GDP. In the late 1940s, debt interest payments reached close to 10% of GDP (though I can’t find a source for this, yet)

Why is it cheap to service debt despite rise in government borrowing?

10-year-bond-yield-84-2012

The recent recession has seen a record fall in bond yields.  Bond yields have fallen since start of crisis because

Read more

Falling US Tariff Rates 2013

Graph showing falling import tariff rates in the US. Figures for 2011 includes estimates for tariff rates up to 2011. The key part of this years report is the fact that import tariff barriers have fallen considerably, meaning potential welfare gains of reducing import tariffs have fallen. US has one of lowest tariff rates, but …

Read more

Debt as % of Tax Revenue

Readers question: Why is public debt stated as a proportion of GDP and not as a proportion of the government tax take?

Generally, government debt is shown as a % of real GDP because this is best reflection of a countries ability to repay.

For example, in France, the government spends 52% of GDP (National Output). In Switzerland, the government spends just 32%. In France the government takes a higher share of tax than in Switzerland. If France and Switzerland had equal levels of debt, then Switzerland would look more indebted, because the debt would be a higher % of tax revenue. French debt would look a smaller burden because the tax revenue is relatively larger.

However, this wouldn’t completely reflect the ability to repay the debt. For example, if Switzerland had a high level of debt to tax, it is in a better position to increase tax rates to raise more revenue if necessary. France by contrast already has high tax rates, and when France tries to increases tax rates it may create disincentives (like famous movie stars moving to Russia).

Also, you could argue that a lower tax country like Switzerland will encourage more private enterprise and a stronger economy. If a country was strangled by high taxes. It would see it’s debt to tax ratio fall, but the economy may weaken.

However, although it is best to measure government debt as a % of GDP, it is still useful to examine debt as a proportion of government tax take. For example, some developing economies struggle to raise tax revenue. A large proportion of GDP may be beyond the government. If the government can only collect 10% of GDP in tax revenue, this limits their ability to repay even modest levels of debt. It is definitely worth taking into account.

Read more

Item added to cart.
0 items - £0.00