Benefit spending in the UK

A quick look at benefit spending in the UK. This is a follow up to  Social security spending. Thanks to HM Treasury for help in finding useful data set.

Source: Public Expenditure Statistical Analysis 2014 | Data Chapter 5 – 5.2

Social Protection spending

Firstly, there has been a modification to the category of government spending, now labelled – ‘Social protection spending’ – See: Social protection spending. This is not just welfare benefits. It includes personal social services, e.g paying for nursing, care in the community; (spending which could  perhaps be better included with health care).

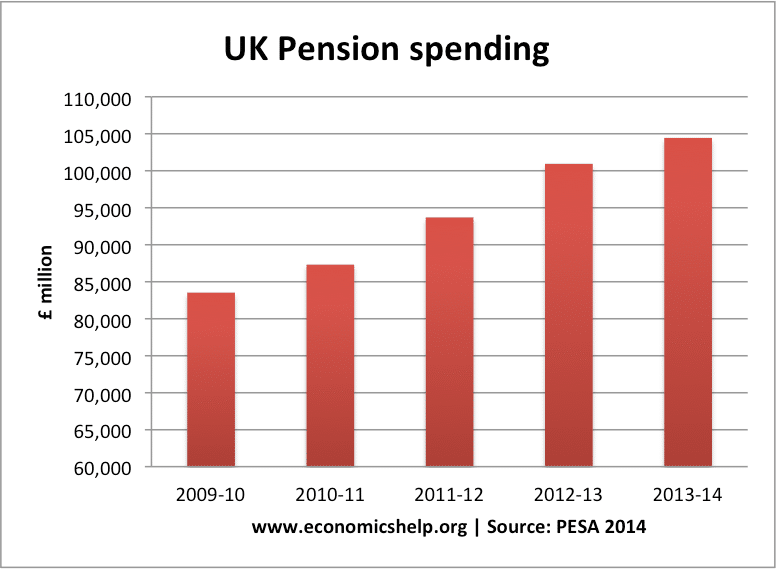
Secondly, by far the biggest level of social protection spending is pension spending. This includes both state pension payments and (I believe) state occupational pensions to retired public sector workers.

social-protection

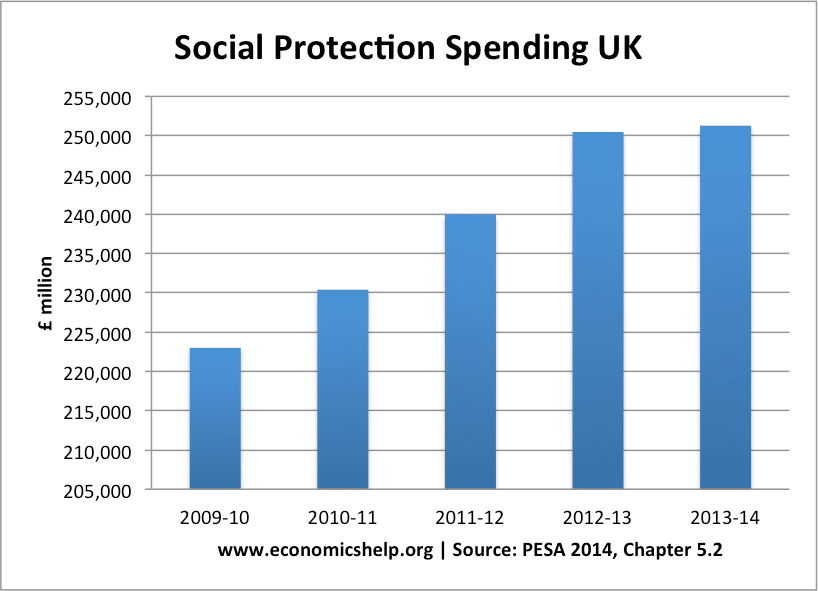
It is a very unwieldy sub-division of government spending, but if we look at whole budget it increased significantly during the great recession 2009-2013. This is partly due to the cyclical higher welfare payments expected during a period of unemployment and low income growth.

However, on closer examination, by far the biggest increase in spending from the social security budget is from pensions. Pension spending increased from £83bn in 2009/10 to £104.4 bn in 2013/14. An increase of £21 bn. In a period of so called austerity, that is a big increase in government spending.

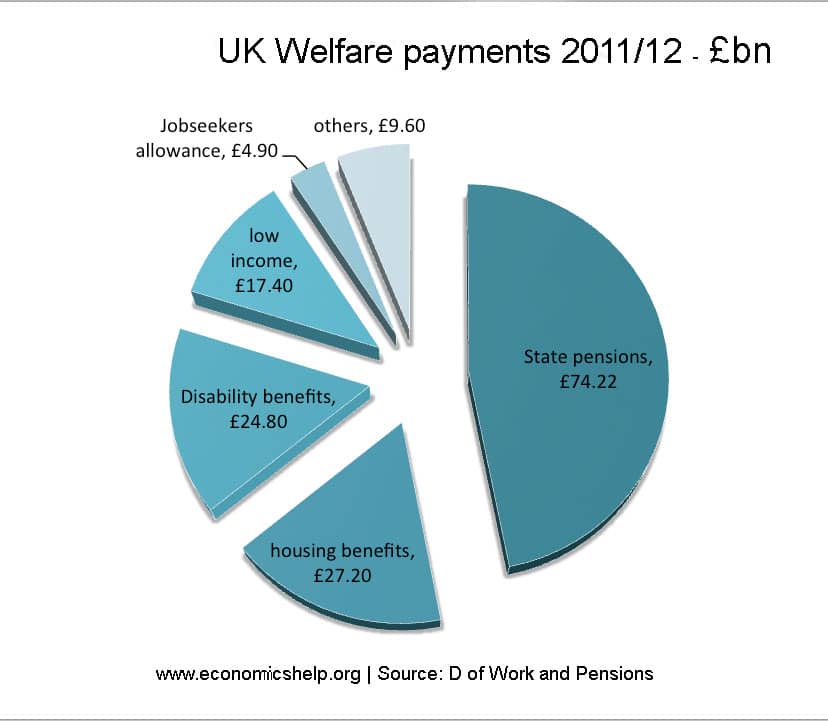
  • Unemployment benefit payments fell in this period from £5.5 bn to £4.9 bn
  • Sickness and disability benefits rose from £30.6 bn to £37.5 bn
  • Income support, tax credit (both family and social exclusion) declined from (£45.8bn) to £ 43.9 bn)
  • Housing benefit from £22bn to £26bn (see: more on Housing benefit)

UK Pension spending

pension-spending-uk

Read more

Mansion tax – pros and cons

Wealth inequality UK

A mansion tax (or property tax) would be an annual progressive charged that would be paid by homeowners. It is effectively a tax on housing wealth. The Labour party has suggested implementing a property tax on homes worth over £2 million. Exact details have not been confirmed, but the suggestion is that it will be a progressive tax meaning the greater the value of the homes, the more the annual tax will be.

In 2010, the Lib Dems proposed a mansion tax based on 1% of a property’s value above £2m. This threshold would also rise in line with increasing house prices. In this case a property worth £2.5 million would pay an annual tax of £5,000 a year.

Proponents of the tax argue that it will help raise revenue, cool a booming property market and help to redistribute the great increase in wealth inequality that we have seen within the UK.

Critics argue that it could lead to people who are property rich, but income poor, struggling to pay the annual charge.

Benefits of a Mansion Tax

In recent decades, the UK has seen a dramatic increase in wealth inequality. House prices have risen above the rate of inflation making many homeowners much better off. But, those who cannot get on the property ladder are struggling with very high rents and an inability to get on the property ladder.

Wealth inequality UK Source: Wealth and Assets Survey – Office for National Statistics

A report by the ONS shows that there is considerable wealth inequality within the UK.

Read more

UK Social security budget

A look at how much the UK government spend on social security, benefits and welfare payments.

Note. I found it very difficult to find stats on how much the government spends on various benefits. The most helpful places were.

Headline stats

Total public spending 2013/14 – £686 billion.

  • Social security budget- £251 billion 37% of 2013/14 spending
  • State pensions account for £83 billion
  • Welfare spending of £168 billion or roughly 25% of budget
  • Benefit spending – of the £205 billion or so spent on tax credits and social security benefits, the IFS calculate about £111 billion is spent on those over pension age and £94 billion on those of working age.
  • Source: welfare spending at IFS

Benefit spending in the UK

The only breakdown I could find of benefit spending was from this Guardian data doc. Using original data from the Department of Work and Pensions .


Welfare benefits (billion, bn)

  • Housing benefit    £16.94
  • Disability allowance    £12.57
  • pensions credit +MIG    £8.11
  • iIncome support    £6.92
  • Rent rebates    £5.45
  • Attendance allpwance    £5.30
  • Incapacity    £5.30
  • Jobseekers allowance    £4.90 (0.7% of total spending)
  • Council tax benefit    £4.80
  • employment + Support    £3.58
  • sick + maternity pay    £2.55
  • Social fund    £2.37
  • carers allowance    £1.73
  • financial assistance    £1.24
  • Total £159


uk-welfare-payments

Main groups of welfare payments

  • State pensions    £74.22
  • housing benefits    £27.20
  • Disability benefits    £24.80
  • low income    £17.40
  • Jobseekers allowance    £4.90
  • others    £9.60
  • total    £159

Where:

  • housing = housing benefit + rent rebate + Council tax benefits
  • disability = disability allowance, incapacity benefit, carers allowance
  • low income support – pensions credit, minimum income guarantee, social fund

Read more

Housing benefit in the UK

housing-benefits-number

Readers Question: There are around 22 million households in the UK, 2/3 of whom own their house.
So the rental market would be around 7 million of whom one million receive benefit, some portion living in social housing, some in private rented housing. Does that seem reasonable? Can you point me towards actual numbers?

In August 2014, 4.93 million received housing benefit, at an average weekly payout of £93. This gives a rough annual cost of £23 billion. Dept Work and Pensions

What is housing benefit?

Housing benefit is a means tested benefit paid to the unemployed and low paid to help with the cost of rent. For a family living in a large four bedroom house – housing benefit can be up to £400 a week. (Housing Benefit.gov.uk)

The aim of housing benefit is to help those on low income afford their housing costs.

  • It is particularly important for areas of high housing costs, such as London. Without housing benefit, there would likely be a shortage of workers because people would have to move away to cheaper areas.
  • Housing benefit helps to reduce inequality and relative poverty by helping people with their major living costs.
  • Housing benefit can help avoid homelessness by giving people help with housing costs.
  • Housing benefit can be claimed with other benefits, such as unemployment benefit and tax credits.

Whether you are eligible and the amount you get is determined by a local authority housing allowances (LHL)

Number claiming housing benefit

housing-benefits-number

Housing Benefit case load statistics Dept Work and Pensions

Source: Single Housing Benefit Extract (SHBE), via Stat-Xplore

Of this 4.93 million

  • 1.28 million are over 65.
  • 468,000 are receiving job seekers allowance
  • 3.3 million are in the social rented sector. 1.6 million are in the private rented sector
  • The biggest area for receiving benefits was London with 835,000.

The great recession of 2008-2014 saw a marked rise in the numbers eligible for housing benefit. The numbers claiming housing benefit peaked at just over 5 million in early 2014. In Aug 2014, 4.93 million received housing benefit.

The rise in numbers claiming housing benefit is due to factors such as:

  • Fall in real wages causing more people to be eligible for income related means tested benefits.
  • Rise in unemployment during the great recession, which significantly reduces income.
  • Rise in cost of renting during this period.

Read more

Is the younger generation worse off than their parents?

Readers Questions: is this the worse time to be a young adult in the UK?

I will answer this question primarily from the economic point of view.

The first thought that springs to mind is that if you look at the long history of the UK, this is probably a good time to be young in the UK.

real-gdp-growth-55-14

Median incomes are close to an all time high (even despite the fall since since the 2008 crisis), educational opportunities are arguably better than before (even if more expensive), unemployment is relatively low and likely to fall (even if there is greater insecurity in the new job market).

It is always tempting to think that every thing was rosy in the past. But, living standards have consistently risen in the past few decades. It is true, that for the past five years, real incomes have stagnated even fallen, throwing into greater contrast rising living costs, especially housing. However, were the previous generation really better off?

Economic problems facing young people

There are several reasons to be concerned about prospects for young people.

Firstly, housing is a real problem. There is a serious shortage of affordable housing – especially in London and the south. This means that many young people simply can’t afford to buy a house like their parents generation could. Home ownership rates are falling – especially amongst people under 30.

house-price-income

House prices are rising faster than incomes. See more at UK housing market stats – including house price to income ratios. For many young people, buying a house is just an impossibility.

Read more

The failure of quantitative easing?

Readers Question. Just saw a video called ‘How to waste £375 billion? (The Failure of Quantitative Easing)’ by Positive Money. I’ve recently started reading your blog and find your posts very informative. I wonder what you make of the ideas in this video and of this group in particular?

(I haven’t seen the video. For some reason I never like watching videos only reading articles.)

I would say Quantitative easing has been a quantified success. Or perhaps a better way of evaluating quantitative easing is that – it could have been worse, if we hadn’t pursued quantitative easing.

A simple comparison is to compare the UK and US (who have both pursued quantitative easing) with the Eurozone (which hasn’t). In the past couple of years, the economic recovery has been stronger in the US and UK, the Eurozone is in danger of a double dip (or triple dip) recession. The Eurozone is heading towards a dangerous period of deflation. The UK and US have at least a better inflation rate.

Eurozone inflation

eurozone inflation

Therefore, I wouldn’t say we wasted £375 billion. Firstly, ‘wasting’ implies an opportunity cost – for example, finding it from higher taxes or lower spending. It was entirely created. For all its faults and limitations, the quantitative easing we pursued was better than nothing – especially given the degree of fiscal tightening pursued since 2010.

Problems with UK Quantitative easing

Perhaps a better description of UK quantitative easing is a wasted opportunity. True, we avoided some deflationary effects, but there are reasons to be disappointed and perhaps it could have been better.

Banks largely used the newly created money to make a profit from selling bonds to the Bank of England and improve their balance sheets; because of the recession, little of this extra money fed through into the real economy through higher bank lending (see: M4 lending stats). The side effect was some banks and the bond market did very and interest rates are at very low rates. True, low rates are part of the aim behind Quantitative easing, but low interest rates are of limited benefit, if firms are unable / unwilling to borrow and make use of cheap borrowing.

Parts of the financial services industry has benefited very well from quantitative easing. It is perhaps a little galling to see many of those culpable for aspects of the credit crisis gaining bonuses from the benefits of quantitative easing.

However, to say it solely benefited the rich is to ignore the contribution it may have made to reducing unemployment. UK unemployment has fallen for many reasons – the small economic stimulus is an important factor – never forget reducing unemployment is one of the most important factor in reducing relative poverty. The UK unemployment rate is now 50% lower than many areas in the Eurozone.

Who benefited from quantitative easing?

Printing money to fund government deficit

Would a better form of quantitative easing have been to print a smaller amount of money, but directly use this to finance government budget deficit, and / or fund public sector investment?

Some argue this would have directly led to higher demand and a stronger economy.

Read more

The battle for market share in UK supermarkets

The UK grocery market has become increasingly competitive in the past few years. It is a good example of an oligopoly becoming more competitive. Certainly, the growing strength of discount giants like Aldi and Lidl have really shaken up the market and diluted the cosy oligopoly previous enjoyed by the likes of Tesco and Sainsbury. …

Read more

The limitation of economic data

Readers Comment from UK debt under Labour. In 13 years from 1997/8 to 2009/10, the Labour Government increased debt by about £420 billion. In the 5 years from 2010/11 to 2014/2015, the Coalition Government will increase debt by about £600 billion. These are the facts.


public-sector-debt-ons

Yes, though I’m always nervous about extracting facts like this.

It is true that under the Coalition government of 2010 onwards public sector debt has increased significantly. Debt to GDP has increased at a rapid rate. But, that doesn’t mean it is a reason to blame the coalition government for rising debt. Rising public sector debt was both inevitable and desirable given the poor global economic performance,  shrinking tax base and expansionary fiscal policy of the previous government.

I would argue, that 2010-2014 – it’s a shame government borrowing didn’t increase a little more. In a recession, with a fall in private sector spending, and rapid rise in private sector saving – you want to see an increase in government borrowing to help maintain overall demand, especially with Q.E, low inflation and low interest rates,.

Comparing debt levels from 1997 to 2010 and comparing debt levels during the great recession is a very difficult comparison. The economic situation is so different, that the required response needed is also very different.

However, the point about UK debt under Labour. was to make the point that (contrary to many people’s opinion) UK government borrowing had fallen to a near record post-war low in the run up to the credit crunch. Excessive government borrowing was definitely not a cause of the crisis of 2008 onwards.


Economic growth

Another thing that can make me suspicious is when people point to very recent quarterly economic growth figures and claim that as vindication or otherwise of a particular economic policy.

economic-growth-quarterly
UK growth – good record in past six quarters

Read more

Item added to cart.
0 items - £0.00