- This is a list of the gross national debt of 178 countries, showing the variation in debt levels from Venezuela at 304% of GDP to Macau at 0% of GDP.
- National debt refers to the amount of total government debt a country has. This is also referred to as ‘public sector debt’.
- It is compiled using data from the IMF.
- Note: National debt is different to ‘External debt‘ – External debt includes all the debt a country (both private and public sector) owes to foreigners.
- Updated 1 September 2021.
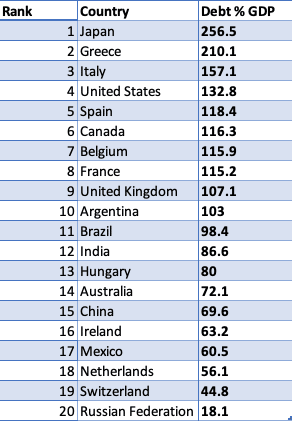
Debt of selected economies
List of National Debt by Country
Levels of general gross government debt. Debt levels as % of GDP for 2021 (² unless stated)
| Rank | Country | Debt levels as % of GDP for 2021 |
| 1 | Venezuela ² | 304 |
| 2 | Japan | 256.5 |
| 3 | Sudan | 211.7 |
| 4 | Greece | 210.1 |
| 5 | Eritrea | 175.6 |
| 6 | Suriname | 157.4 |
| 7 | Italy | 157.1 |
| 8 | Lebanon ² | 154 |
| 9 | Barbados | 143 |
| 10 | Maldives | 139.7 |
| 11 | Cabo Verde | 137.6 |
| 12 | Belize | 134.6 |
| 13 | United States | 132.8 |
| 14 | Portugal | 131.4 |
| 15 | Singapore | 129.5 |
| 16 | Bahrain | 129.4 |
| 17 | Mozambique | 125.3 |
| 18 | Bhutan | 123.4 |
| 19 | Zambia | 118.7 |
| 20 | Spain | 118.4 |
| 21 | Canada | 116.3 |
| 22 | Belgium | 115.9 |
| 23 | France | 115.2 |
| 24 | Cyprus | 113 |
| 25 | Angola | 110.7 |
| 26 | United Kingdom | 107.1 |
| 27 | Sri Lanka | 105.4 |
| 28 | Argentina (2) | 103 |
| 29 | Brazil | 98.4 |
| 30 | Jamaica | 96.5 |
| 31 | Dominica | 96.4 |
| 32 | Montenegro | 94.6 |
| 33 | Egypt | 92.9 |
| 34 | Jordan | 91.2 |
| 35 | Tunisia | 91.2 |
| 36 | Congo, Republic of | 90.5 |
| 37 | Bahamas, The | 88.6 |
| 38 | El Salvador | 88.2 |
| 39 | Mauritius | 87.7 |
| 40 | Pakistan | 87.7 |
| 41 | Austria | 87.2 |
| 42 | India | 86.6 |
| 43 | Croatia | 86.3 |
| 44 | Fiji | 83.6 |
| 45 | Iceland | 82.5 |
| 46 | Ghana | 81.5 |
| 47 | South Africa | 80.8 |
| 48 | Slovenia | 80.5 |
| 49 | Hungary | 80 |
| 50 | Israel | 78.3 |
| 51 | Guinea-Bissau | 78.1 |
| 52 | Mongolia | 77.9 |
| 53 | Morocco | 77.1 |
| 54 | Malawi | 76.8 |
| 55 | Burundi | 75.6 |
| 56 | Albania | 75.4 |
| 57 | Grenada | 74.5 |
| 58 | Gambia, The | 73.9 |
| 59 | Kyrgyz Republic | 73.4 |
| 60 | Yemen | 73 |
| 61 | Costa Rica | 72.5 |
| 62 | São Tomé and Príncipe | 72.4 |
| 63 | Australia | 72.1 |
| 64 | Kenya | 71.5 |
| 65 | Namibia | 71.4 |
| 66 | Oman | 71.3 |
| 67 | Gabon | 71.1 |
| 68 | Germany | 70.3 |
| 69 | Armenia | 69.9 |
| 70 | Iraq | 69.7 |
| 71 | China, People’s Republic of | 69.6 |
| 72 | Bolivia | 69 |
| 73 | Finland | 68.8 |
| 74 | Lao P.D.R. | 68.3 |
| 75 | Uruguay | 68 |
| 76 | Malaysia | 67 |
| 77 | Senegal | 66.8 |
| 78 | Dominican Republic | 66.6 |
| 79 | Rwanda | 66 |
| 80 | Ecuador | 65.1 |
| 81 | Puerto Rico | 64.8 |
| 82 | Colombia | 64.2 |
| 83 | Slovak Republic | 64 |
| 84 | Emerging market and developing economies | 64 |
| 85 | Georgia | 63.9 |
| 86 | Algeria | 63.3 |
| 87 | Ireland | 63.2 |
| 88 | Trinidad and Tobago | 62.1 |
| 89 | Panama | 61.4 |
| 90 | Mexico | 60.5 |
| 91 | Togo | 60 |
| 92 | Qatar | 59.8 |
| 93 | Serbia | 59 |
| 94 | Ukraine | 58.1 |
| 95 | Malta | 57.9 |
| 96 | Poland | 57.4 |
| 97 | Liberia | 57 |
| 98 | Mauritania | 56.3 |
| 99 | Netherlands | 56.1 |
| 100 | Ethiopia | 56 |
| 101 | Thailand | 55.9 |
| 102 | Honduras | 53.9 |
| 103 | North Macedonia | 53.8 |
| 104 | Korea, Republic of | 53.2 |
| 105 | Romania | 52.6 |
| 106 | Philippines | 51.9 |
| 107 | Zimbabwe | 51.4 |
| 108 | Lesotho | 49.8 |
| 109 | Tajikistan | 49.8 |
| 110 | Nepal | 49.6 |
| 111 | Papua New Guinea | 49.6 |
| 112 | Lithuania | 49.5 |
| 113 | Myanmar | 49.1 |
| 114 | Samoa | 49 |
| 115 | Uganda | 48.8 |
| 116 | Vietnam | 48 |
| 117 | West Bank and Gaza | 47.9 |
| 118 | Benin | 47.7 |
| 119 | Nicaragua | 47.6 |
| 120 | Latvia | 47.2 |
| 121 | South Sudan, Republic of | 47 |
| 122 | Madagascar | 46.9 |
| 123 | Burkina Faso | 46.8 |
| 124 | New Zealand | 46.4 |
| 125 | Côte d’Ivoire | 46.3 |
| 126 | Mali | 46.1 |
| 127 | Belarus | 45.7 |
| 128 | Switzerland | 44.8 |
| 129 | Niger | 44.5 |
| 130 | Equatorial Guinea | 44.1 |
| 131 | Czech Republic | 44 |
| 132 | Tonga | 43.7 |
| 133 | Cameroon | 42.5 |
| 134 | Guinea | 42.3 |
| 135 | Uzbekistan | 42.3 |
| 136 | Central African Republic | 42.2 |
| 137 | Chad | 41.7 |
| 138 | Denmark | 41.6 |
| 139 | Norway | 41.6 |
| 140 | Guyana | 41.4 |
| 141 | Indonesia | 41.4 |
| 142 | Sweden | 40.4 |
| 143 | Bangladesh | 40.2 |
| 144 | Djibouti | 40.2 |
| 145 | Moldova | 39.5 |
| 146 | Bosnia and Herzegovina | 38.6 |
| 147 | Tanzania | 37.9 |
| 148 | Turkey | 37.1 |
| 149 | United Arab Emirates | 37.1 |
| 150 | Iran | 36.6 |
| 151 | Paraguay | 35.7 |
| 152 | Peru | 35.4 |
| 153 | Chile | 33.6 |
| 154 | Cambodia | 33.4 |
| 155 | Guatemala | 33.1 |
| 156 | Taiwan Province of China | 32.5 |
| 157 | Nigeria | 31.9 |
| 158 | Saudi Arabia | 31 |
| 159 | Azerbaijan | 30.9 |
| 160 | Kazakhstan | 27 |
| 161 | Luxembourg | 26.8 |
| 162 | Haiti | 26 |
| 163 | Turkmenistan | 26 |
| 164 | Bulgaria | 25.5 |
| 165 | Botswana | 25.3 |
| 166 | Estonia | 25.1 |
| 167 | Marshall Islands | 23.3 |
| 168 | Kiribati | 21.4 |
| 169 | Russian Federation | 18.1 |
| 170 | Micronesia, Fed. States of | 15.3 |
| 171 | Timor-Leste | 15 |
| 172 | Kuwait | 13.7 |
| 173 | Congo, Dem. Rep. of the | 12.4 |
| 174 | Tuvalu | 11.8 |
| 175 | Afghanistan | 8.8 |
| 176 | Brunei Darussalam | 2.3 |
| 177 | Hong Kong SAR | 0.9 |
| 178 | Macao SAR | 0 |
All debt levels apply to 2021, except ² No figures for 2021. Debt given for 2020
Source: IMF DataSet, accessed 1 September 2021
Highest levels of Government debt in the world
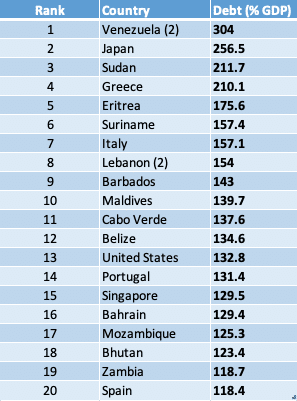
The country with the highest debt to GDP ratio in 2020 was Venezuela (304%) – a reflection of a collapsing economy and failure to collect tax revenues.
The second biggest debt burden is Japan with 256% – though this is very different situation with economic stability and prosperity. The Japanese government is able to borrow from private individuals in Japan. Conflict in Sudan and Eritrea have played a large role in their high debt levels.
Lowest levels of government debt in the world
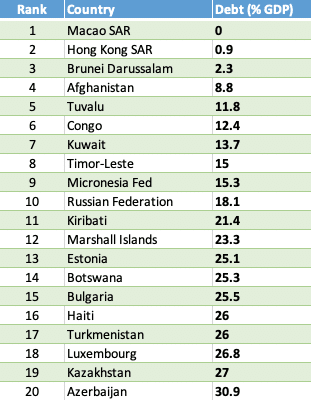
The country with the lowest levels of debt is Macau – an autonomous region on the south coast of China. Macau is the most densely populated region in the world, with one of highest levels of GDP per capita. Nearly 80% of the government’s revenue comes from a thriving gambling industry. Oil producing countries, like Brunei, Kuwait and Kazakhstan have low levels of debt because governments have successfully collected tax revenue from oil.
Some very poor countries like Afghanistan, Congo and Haiti have perhaps surprisingly low levels of debt. One reason is that the country does not have functioning bond markets. There is so much uncertainty that governments do not have the opportunity to borrow.
Problems of national debt
High levels of national debt can cause these potential problems
- Requirement of higher taxes and/or lower spending
- Higher debt interest payments
- Pressure to print money – causing inflation.
- Debt financed by overseas borrowing can lead to external pressure
- Crowding out of the private sector
See: more problems of government borrowing
How much can a government borrow?
- Japan’s national debt is 265% of GDP and has been high for a couple of decades. This reflects the ability of Japan to borrow from domestic citizens. Despite prolonged periods of high debt, interest rates are still low because markets feel the government is still solvent.
- A developing economy like Argentina has a track record of default on debt, therefore markets are less willing to lend money to the government. Therefore when debt levels in Argentina increase it has a greater effect on pushing up interest rates.
Factors that depend on how much a government can borrow include
- Default rates of government
- Inflationary pressures. High inflation will make investors less willing to buy government bonds because they will devalue due to inflation
- Can the government print its own money? If the government can print money it can avoid liquidity issues, though there is potential danger of inflation.
- What are the prospects for economic growth? Higher economic growth makes it easier to reduce debt to GDP ratios over time.
- How much can a government borrow?
Difference between debt and deficit
Government debt is the total amount of outstanding liabilities. The deficit is the annual amount by which spending exceeds income. The debt is the accumulation of past deficits.
For example in 2020, the US deficit was $3.13 trillion. The US total debt is $29 trillion.
Causes of national debt
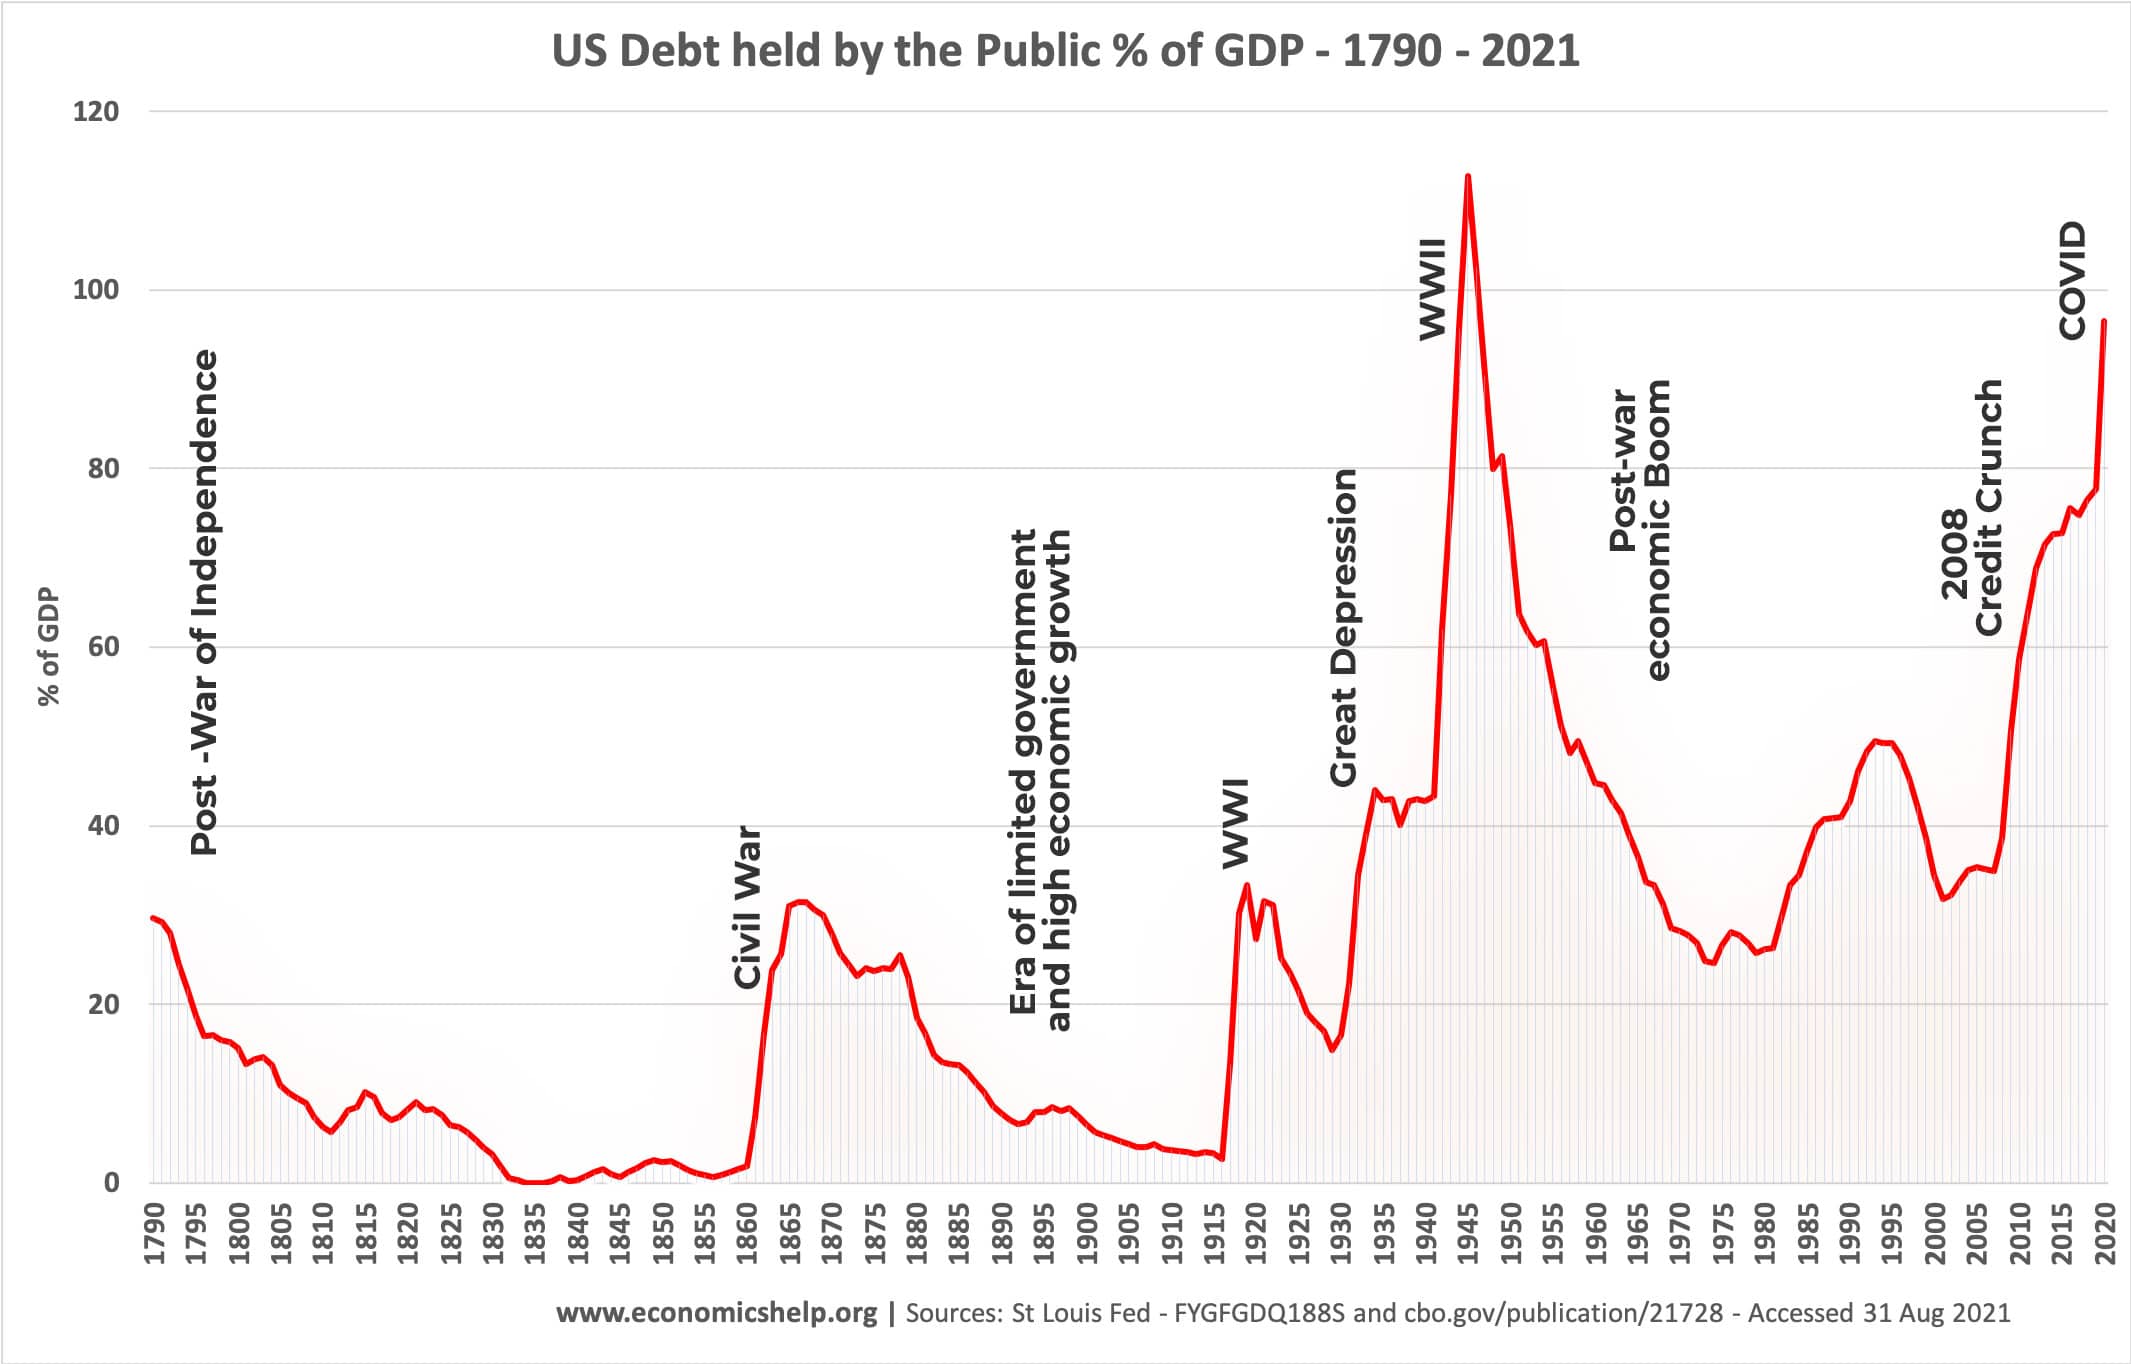
This graph for US national debt shows how national crisis leads to a rise in government borrowing. This isn’t necessarily a bad thing. Government debt enabled the US government to finance the short-term costs of the two world wars. It also enabled the government to respond to the crisis of the 2008 financial crash and the 2020 Covid crisis. Causes of national debt can include
- Recession – tax revenues fall when the economy shrinks. Also the government spend more on unemployment benefits
- Investment – Governments might borrow to build new roads, schools and hospitals.
- Finance war –
- Demographic changes and welfare spending. An ageing population tends to place more strain on government finances with older people requiring more health care spending, pensions and also they pay less income tax.
- Political decisions. Some governments may support higher spending on welfare programmes, whearas other governments may target a balanced budget.
Related
Further Reading
- Why is Japan able to borrow so much at low interest rates?
- Euro Debt crisis explained
- National Debt, printing money and inflation
Readers Question
Why is the US debt listed here as 90.8% of GDP in the opening paragraphs, and then listed as No. 66 at 39.7% of GDP? By other accounts we do seem to be closing in on 100%, and so should be listed between Nos. 11 & 12 (differences between 2008 and 2009 notwithstanding). I wonder if the U.S. could negotiate lower interest rates on its public debts without causing panic, so that it could lower its interest payments, get its economy going again, and pay down the principal over the long term. I know…not as easy as it sounds.
Why is Japans debt so high?
@Kendrick: As I understand it is any level of government’s debt, and that debt is usually owed to the people, but countries with high trade deificiets that money begins to be owed to people oversea’s. And why do we not pay our debt? Because then no other countries would trade with you until you payed the debt, which would be even harder then usual because you wuld have lost a massive percentage of GDP because of the losss of trade(We need oil)
I am still learning so tell me if I am wrong:)
@Wahid: It is because the government pours in money to stimulate the economy, increasing their debt, and if the japanese spent it, future tax revenue, but they save it instead, making the government continue to pour money in. Correct me if I am wrong(:
All debts are owed to somone (or something). If you add all the national debts and subtract the national surpluses (and do not include the domestic loans from the members of the states to their own state) you still wind up with a lot of money owed to the world bank.
How did the world bank get so rich?
The same way all banks make money – by “printing”
So what we need to learn is “Who controls the world bank and the income earned by interests on all those loans?” and “What do they do with all that money?”
When are people in this world going to wake up and realize the banks own them? Dept is money and money is created from dept, no dept, no printing. Once upon a time money was linked to finite assets i.e. gold, silver, rice etc. Now Global banks dictate how much money is in circulation which it creates from thin air and issued as government bonds, which is then lent to national banks who fractionalize that out at 25:1, functioning more money creation, which is paid back in real assets plus usury (interest). If all worlds’ currencies were based on real assets how could the whole word be in dept? It couldn’t. Put this way, if you owned all the gold in the world and loan some out how could you possible gain usury in gold? You couldn’t because you already own it all. Solution, print more money, bankers get richer and the working class feed them.
why is the goverment not doin anything about crime:?
a. Why is debt related to GDP?
An employees debt is not related to their employers income.
The important factor is government income to expenditure i.e. the deficit.
b. the ‘national debt’ should be government, business and private debt.
That would provide a different picture, and the reason why they do not publish it.
External debts is what your government borrows from other countries. GDP is what your country produces. The ratio of what you owe others and what you produce is the same as the ratio of what you earn versus the loan you have with the bank. If you borrow $1000 from the bank and you earn $100 then the ratio of debt to income is 10 (1000/100). The relationship you had between your salary and employer’s debt is not a valid one.
If almost every nation has a deficit, can’t that debt be offset to some world credit system that allows each country to pay it back, interest free, over say 100 years?
The burden of debt on today’s world population is far too big for us to pay off in our lifetime. There is so much poverty in the world and yet we have the people, skills and materials to fix that – we just don’t have the money!
I thought the World Bank or the IMF was there to help countries balance their budgets, but I guess they too have run out of money.
There must be a fix for this; after all it’s just numbers in a computer.
When all countries have a national debt, a public debt,external debt, just who do they owe this debt to? if it is each other they are all in debt so borrowing from one to another makes no sense except to increase the existing debt.
One would assume that the basis for credit creation the multiple upon a real unemcumbered deposit has disapeared and been replaced with debt upon debt, and as all new loans are new money this also means credit creation upon saturated debt, a bubble of world wide debt waiting for the pinprick.
Canada’s total public debt is in the 80%. The difference between the 34% and the 84% shown in the 2 sources is the provincial debts. Canada’s federal system is decentralized. The provinces assume now approximately 75% of health costs with little control, a bit like in the US, and with the population getting older, they make huge deficits.
The federal Canadian government increases its debt by 5 billion $ per month as of the summer 2011. Quebec, a province representing about 22% of Canadian GDP adds 10 billion $ a year currently.
In total, public debt increases between 5 to 6% of Canadian GDP per year at the current rhythm.
the thing is, just because germany the uk the usa and japan are more productive, they can loan more, so they are able to have a more bloated state leeching of the productive. hence im an anarchist
Greeks according to OAECD are the most hard workers within EU..they work much more than the Germans on a weekly basis…So do the Portuguese…Debt hasnt got to do with lazyness..and Yes Japan and USA have the largest debts in the world..and it doesnt surprise me at all