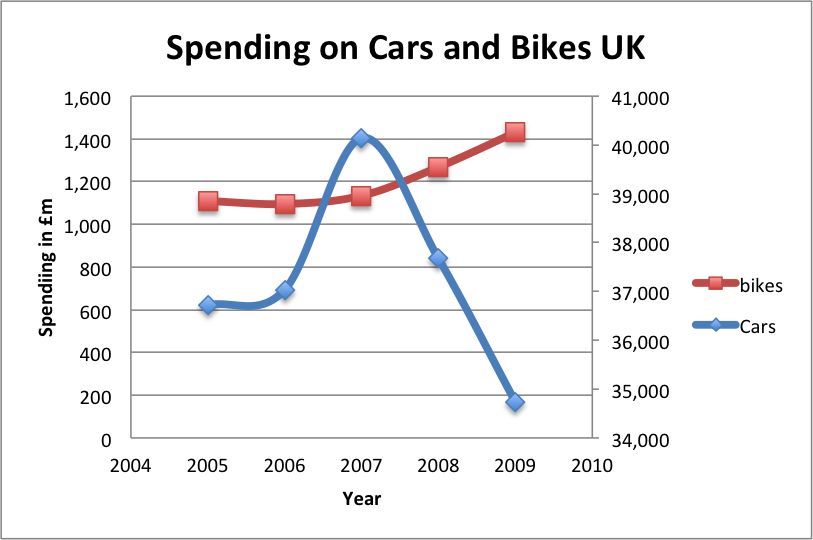
Note: Bicycles left hand side. Cars right hand side
Note: Scale on right hand side doesn’t start at 0, therefore drop in spending on cars looks more pronounced than it actually is.
- 2009 We spent £1.4bn on new bikes and £35bn on cars. [1. Cycle Stats, Cycling Info, ONS]
An interesting statistic to show the relative spending on cars and bikes in post recession Britain.
In the period 2007-09, there has been a combination of rising petrol prices and stagnant or falling real incomes.
This suggests cars are likely to be income elastic ( a change in income causes a bigger % change in demand), whereas bikes may be considered an inferior good ( a fall in income causes a rise in demand). However, we cannot be certain demand for bicycles is an inferior good because the rise in demand for bicycles may not be just due to the fall in income. Rise in demand could also be because of:
- Higher petrol prices make cycling a more viable alternative
- Boom in cycling, especially in London where more cycle lanes have encourage more people to cycle
- Change in tastes and fashions. Greater demand for environmentally friendly forms of transport.
It will be interesting to see what happens when incomes start to increase and cost of motoring falls. This trend may well be reversed.
It shows that during a recession, many firms may lose out, but some may gain. The greater interest in cycling could have positive externalities for the rest of society – lower pollution, healthier population, lower congestion e.t.c.
Related
- The Economics of Cycling
