The original Phillips curve suggested there was a trade-off between nominal wages and unemployment. Higher demand led to rising wages and a fall in unemployment. Lower aggregate demand (AD) led to a fall in nominal wages, but a rise in unemployment.
This was adapted to suggest a trade-off between unemployment and inflation.
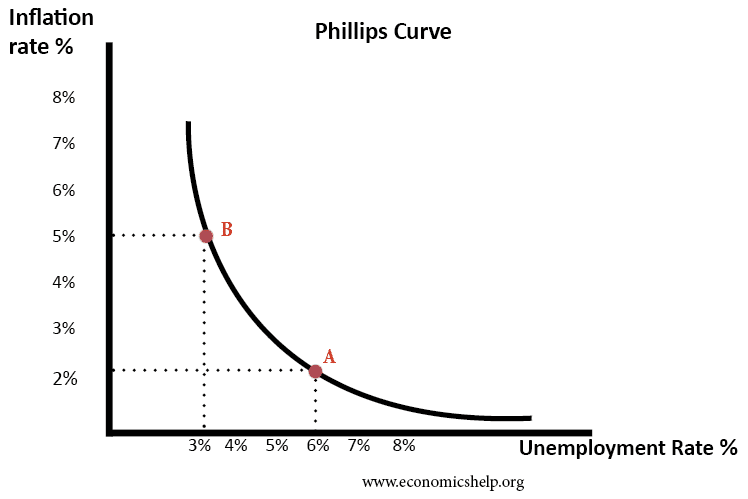
During the 1950s and 60s, there appeared empirical evidence for this trade-off between unemployment and inflation.
Inflation and unemployment in US 1950s and 1960s
Monetarist view
Monetarists, such as Milton Friedman and Edmund Phelps criticise this view of the Phillips Curve. They argue there is no stable trade-off between unemployment and inflation. They go on to argue demand-side policies cannot be used to reduce unemployment in the long-term. A rise in demand may cause a temporary fall in unemployment, but output returns to equilibrium level and unemployment remains determined by supply-side factors – the natural rate of unemployment.
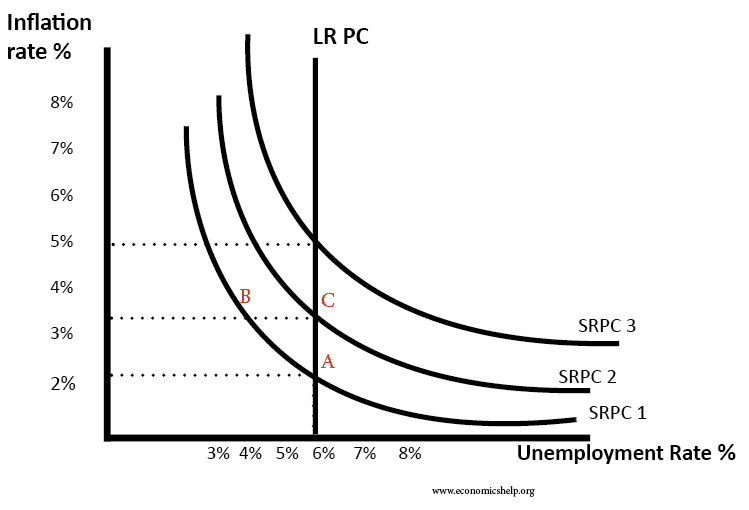
- Monetarists point to the 1970s where there appeared to be a breakdown in the Phillips curve. There was stagflation – rising inflation and rising unemployment.
- The UK, US and other western advanced economies experienced stagflation which is a period of rising unemployment and inflation.
A shift in the Phillips Curve?
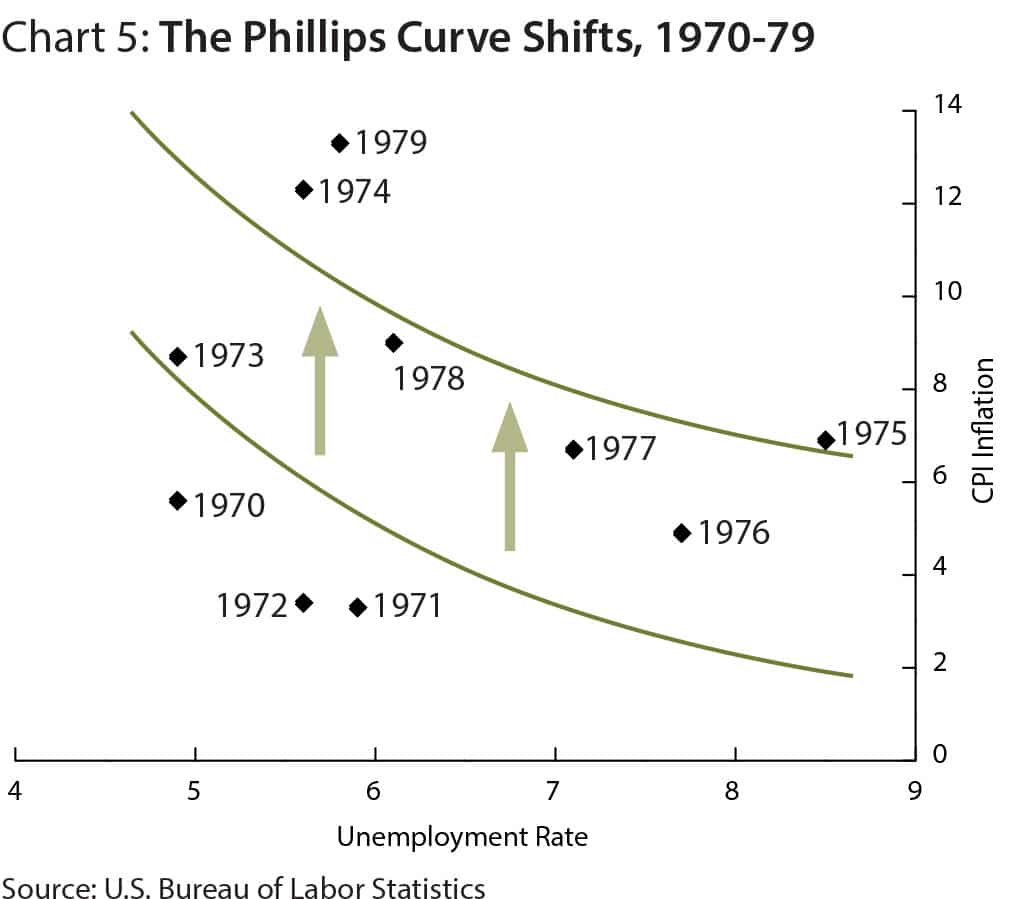
- Keynesians would respond to this by arguing that the Phillips curve had merely shifted to the right because of a rise in structural unemployment and structural inflation. For example, in the 1970s there was an increase in cost-push inflation due to rising oil prices and powerful trades unions.
- Recent evidence in the UK shows us that both inflation and unemployment have fallen since 1992. This suggests that there is not a trade-off but that it is possible to reduce both if there are suitable supply-side policies.
UK unemployment and inflation
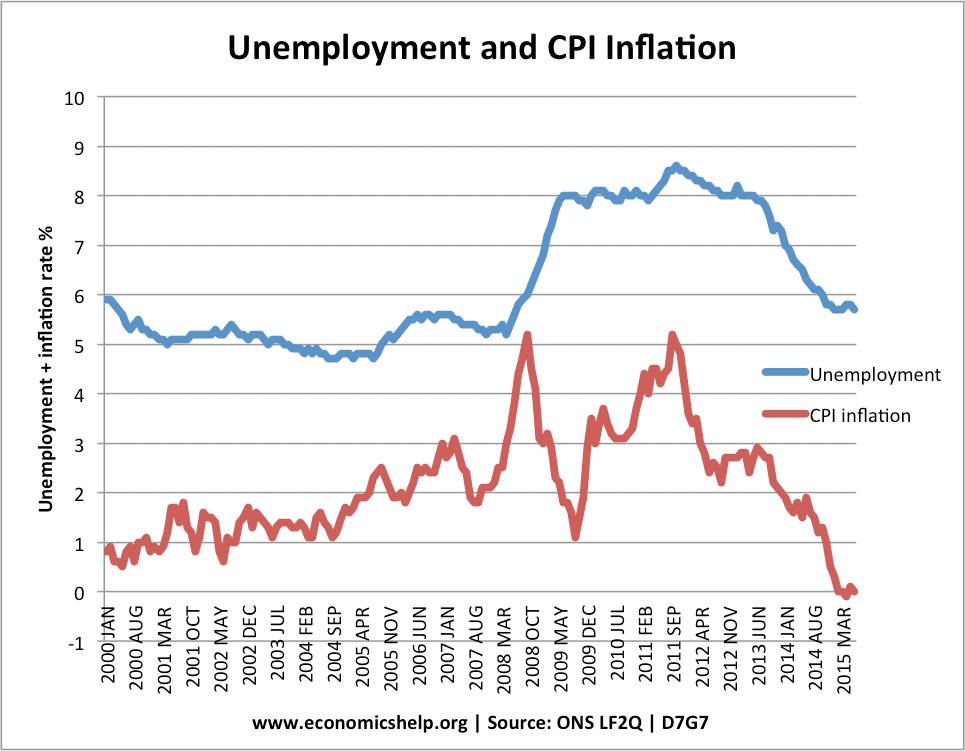
Cost-push inflation preceded the recession and higher unemployment of 2009-12. From 2012, both inflation and unemployment fell.
US Unemployment and Inflation
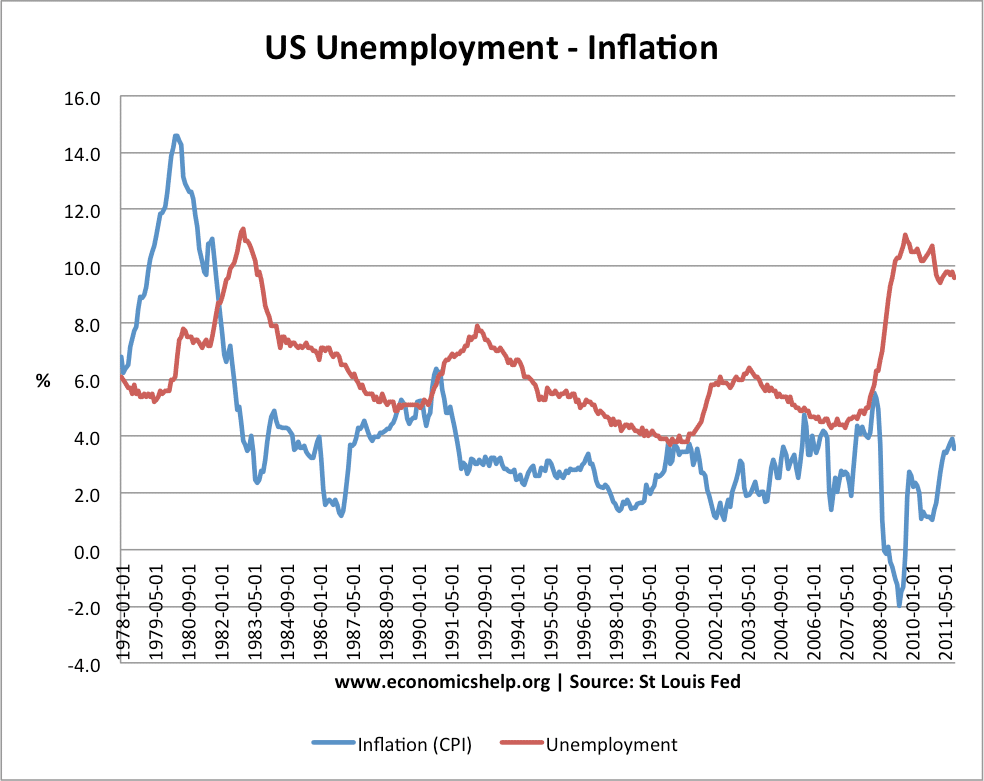
There are occasions when you can see a trade-off between unemployment and inflation. For example, between 1979 and 1983, inflation (CPI) fell from 15% to 2.5%. During this period, we see a rise in unemployment from 5% to 11%. In 2008, the recession caused a sharp rise in unemployment and inflation became negative.
A.W. Phillips (1958) “The Relation Between Unemployment and the Rate of Change of Money Wage Rates in the United Kingdom, 1861-1957,” Economica.
Conclusion
There can be a trade-off between unemployment and inflation under certain circumstances. The 1950s and 60s were a period of low-cost-push inflation and close to full employment. In this environment, policymakers did seem to have a choice between reducing inflation or reducing unemployment.
However, this trade-off between inflation and unemployment can easily break-down if there is a rise in cost-push inflation or change in structural unemployment.
A better relationship is found by looking at the link between real wages and unemployment. Falling unemployment, in theory, should put upward pressure on real wages and vice-versa.
However, even that trade-off is not guaranteed. In the economic recovery since 2012, the UK and US have seen a fall in unemployment, but little, if any upward pressure on real wages. This is due to changing nature of the labour market.
- Labour markets are more flexible.
- Firms have more monopsony power.
- Trade unions are now weak
- Therefore, despite falling unemployment figures workers are not in a position to bargain for higher wages.
Related pages